
EMA (Exponential Moving Average) reacts faster to price than a normal moving average, which makes it…
forex trading

Risk-On / Risk-Off Meter – Real Time Market Sentiment
A Real-Time Snapshot of Global Market SentimentFinancial markets constantly rotate between Risk-On and Risk-Off conditions. Understanding…
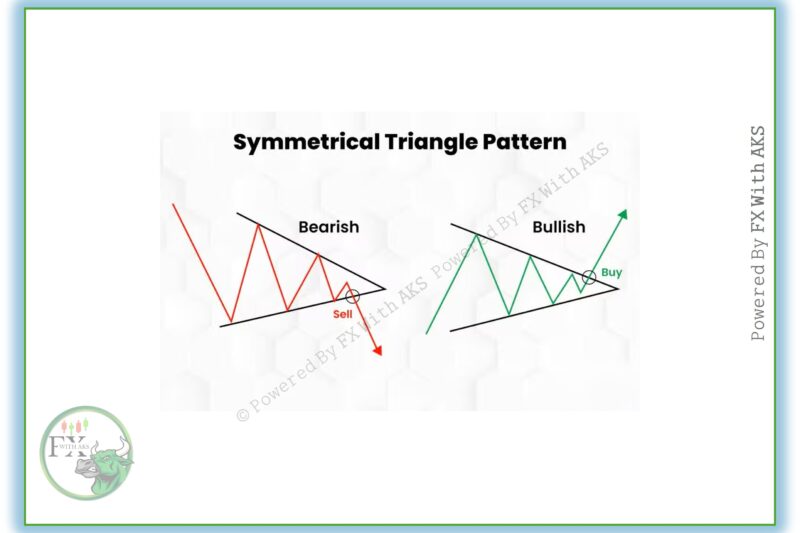
Symmetrical Triangle Pattern in Trading – How to Trade Breakouts | FXWithAKS
A Symmetrical Triangle is a chart pattern that appears when the market is consolidating, and it…
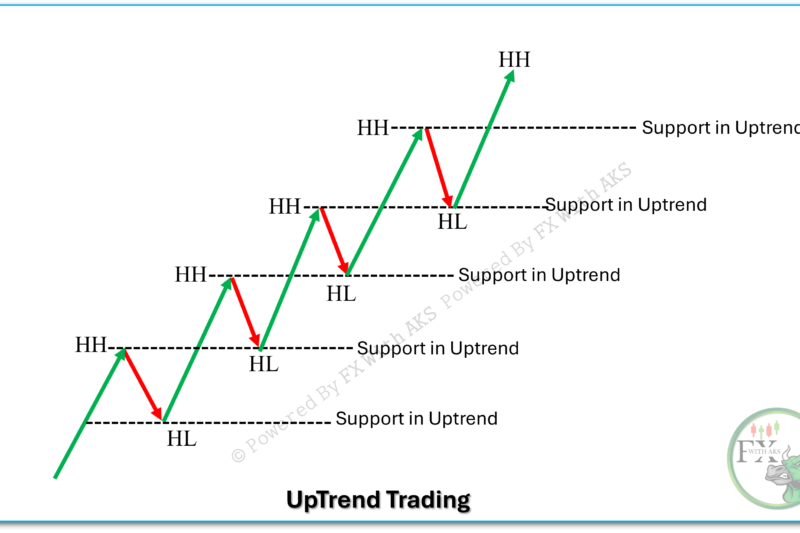
How to Trade an Uptrend in Trading Using Price Action
Uptrend Trading Strategy in Forex (Price Action Guide) Uptrend trading is one of the most reliable…
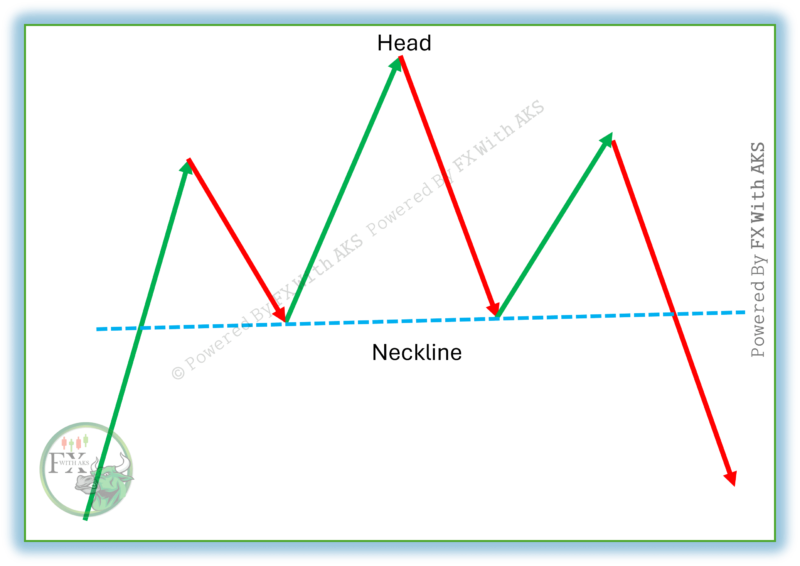
Head & Shoulder Pattern – Explained Definition , How To Trade
The Head and Shoulders pattern is a reversal pattern in technical analysis that signals a potential…
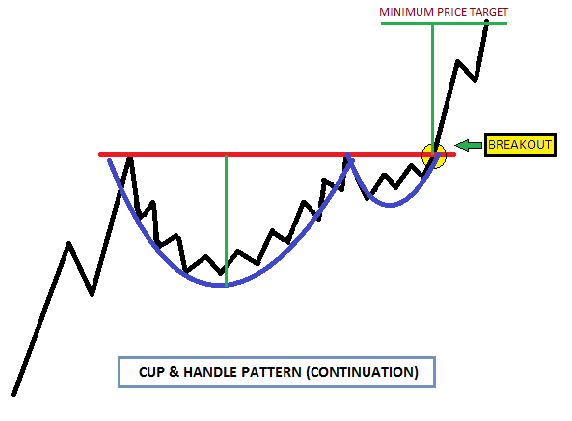
Cup & Handle Pattern – Explained Definition , How To Trade
The Cup and Handle pattern is a bullish continuation pattern in technical analysis, typically signaling a…
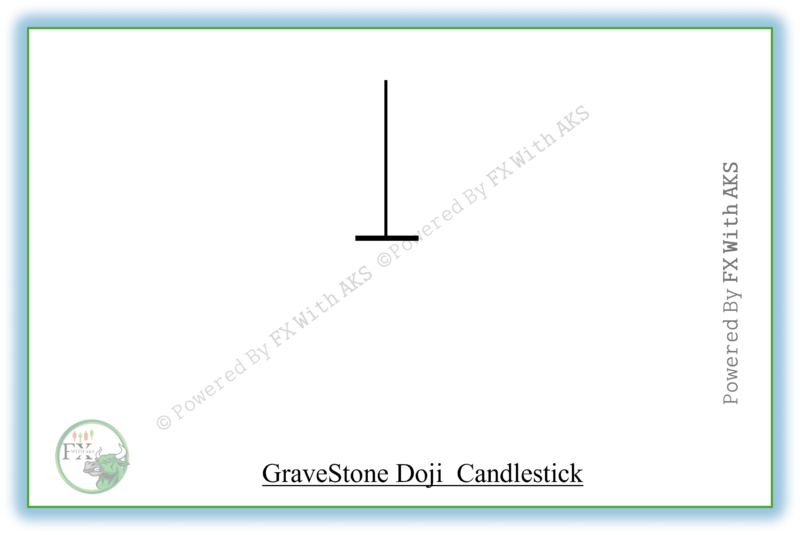
Gravestone Doji Candlestick Pattern – Definition & How to Trade It
The Gravestone Doji is a bearish reversal candlestick pattern that typically appears at the top of…
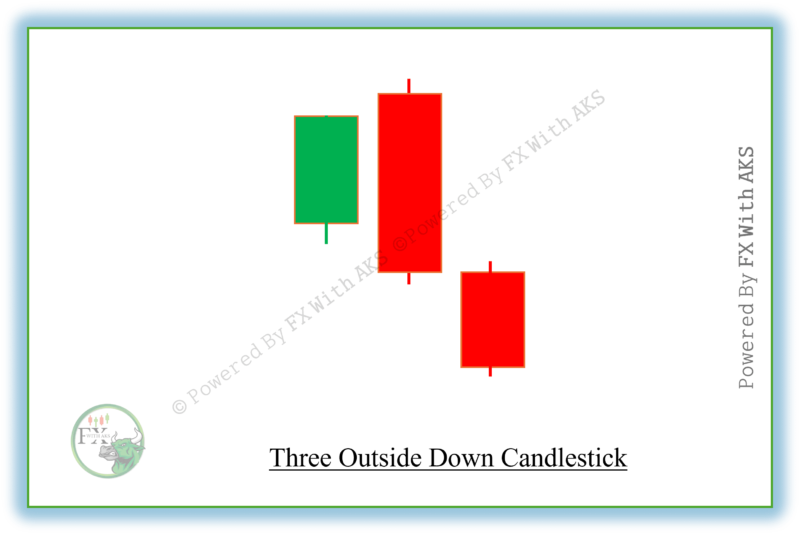
Three Outside Down Candlestick Pattern – Definition & How to Trade
The Three Outside Down is a bearish reversal candlestick pattern that typically appears at the top…
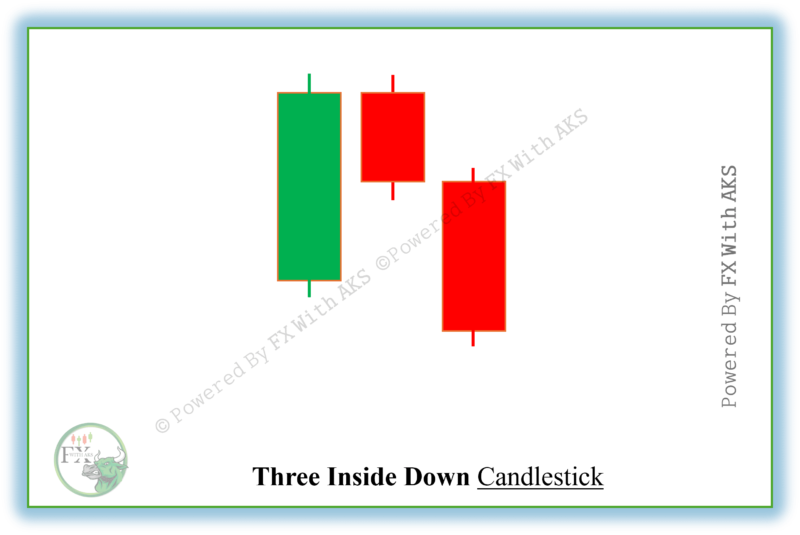
Three Inside Down – Definition , How To Trade
The Three Inside Down is a bearish reversal candlestick pattern that typically forms at the top…
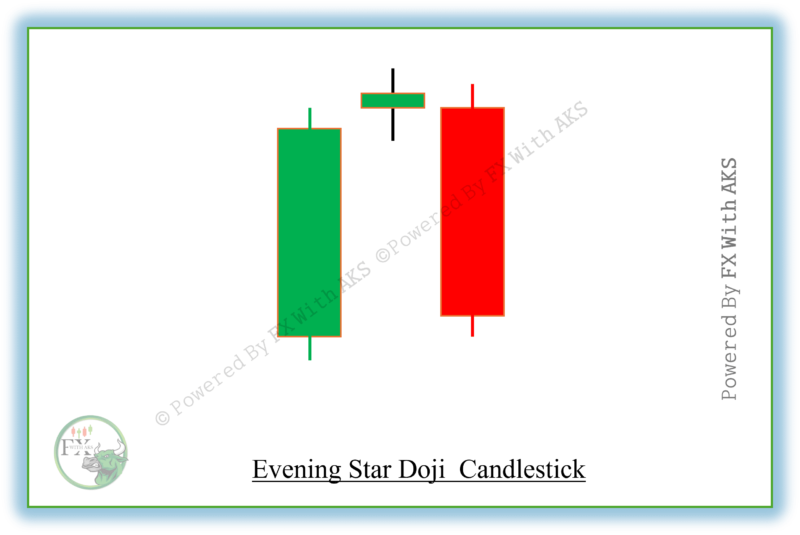
Evening Star Doji – Definition , How To Trade
The Evening Star Doji is a bearish reversal candlestick pattern that typically appears at the top…
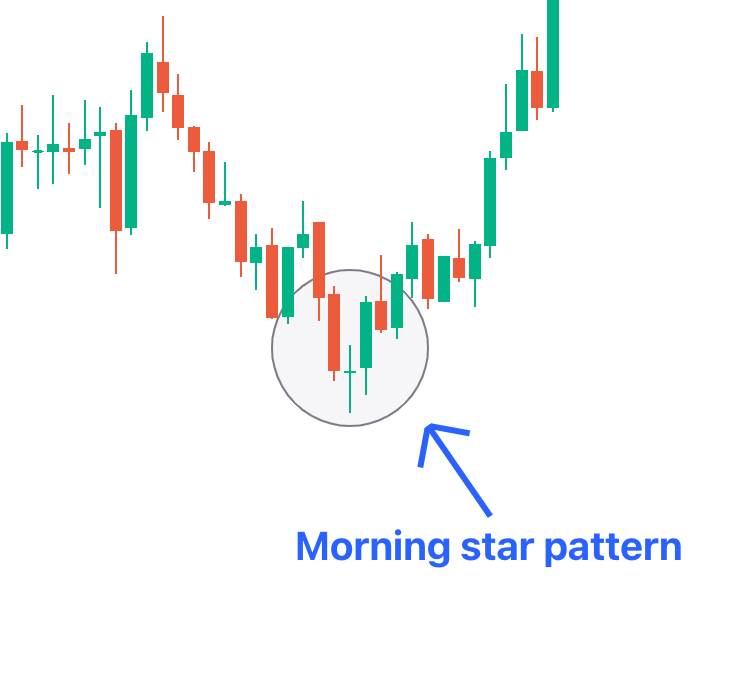
Morning Star Doji – Explained Definition , How To Trade
The Morning Star Doji is a powerful bullish reversal candlestick pattern that typically appears at the…

What Is Price Action ? Guides, Strategies & Full Articles
What Is Price Action? – Introduction of Price Action Trading Price Action Trading is a method…
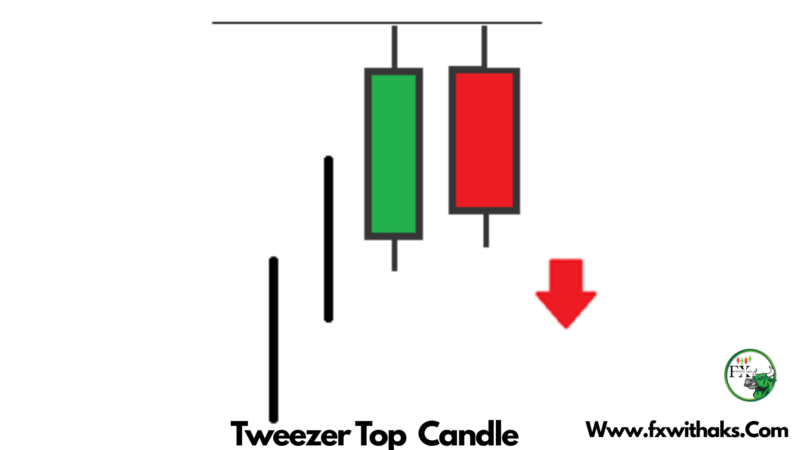
Tweezer Top Candle – Definition , How To Trade
The Tweezer Top is a bearish candlestick reversal pattern that appears after an uptrend, signaling that…
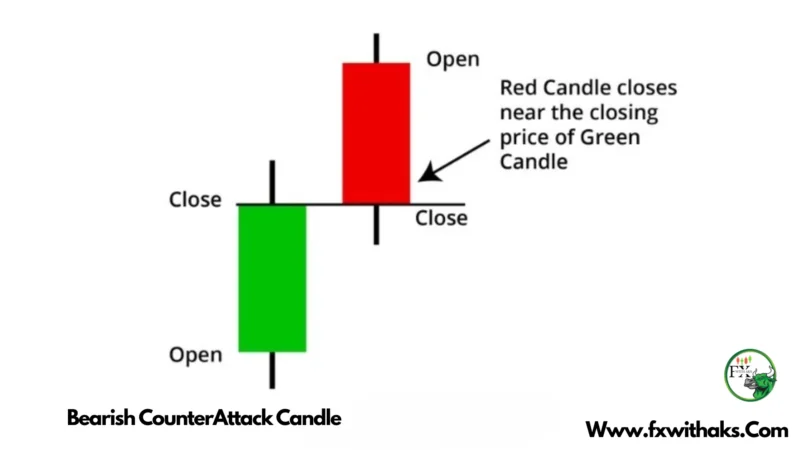
Bearish Counterattack Pattern – Definition , How To Trade
The Bearish Counterattack Pattern is a two-candle bearish reversal pattern seen on candlestick charts, typically at…
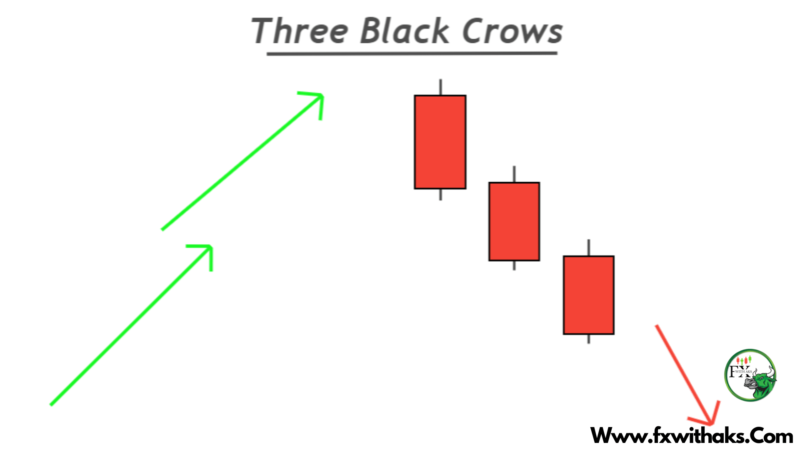
Three Black Crows Candle – Definition , How To Trade
The Three Black Crows is a strong bearish reversal candlestick pattern that signals a potential end…
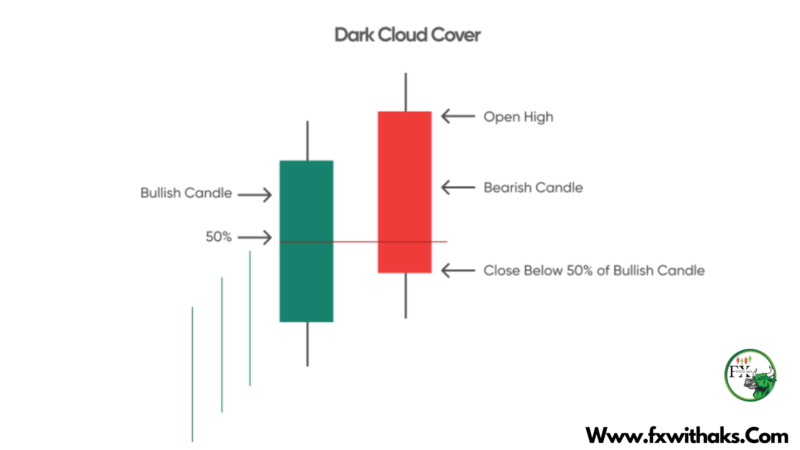
Dark Cloud Candlestick – Definition , How To Trade
The Dark Cloud Cover is a classic bearish reversal candlestick pattern that signals a potential shift…
Bearish Marubozu – Definition , How To Trade
A Bearish Marubozu is a type of candlestick pattern in technical analysis that signals strong selling…
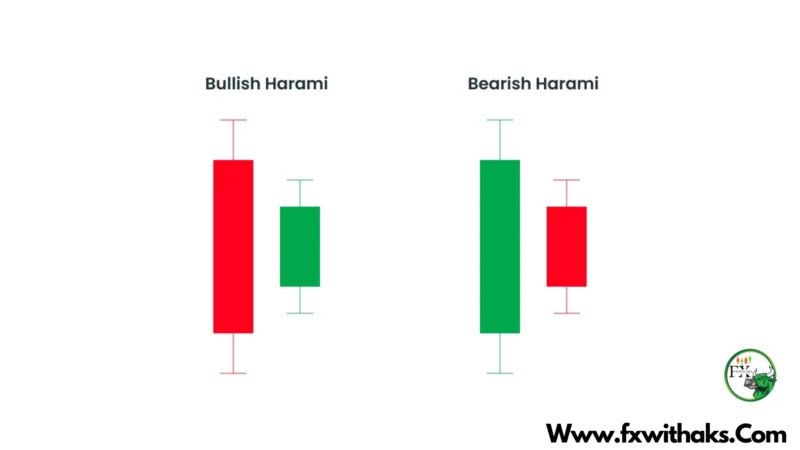
Bearish Harami Candle – Definition , How To Trade
A Bearish Harami is a two-candle chart pattern used in technical analysis, commonly seen as a…
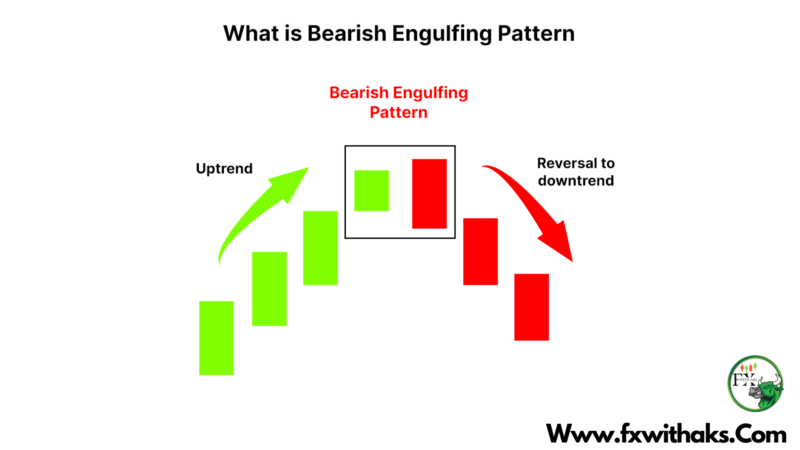
Bearish Engulfing Candle – Definition , How To Trade
The Bearish Engulfing Candle is a classic and powerful bearish reversal candlestick pattern. It’s one of…

Hanging Man Candle – Definition , How To Trade
The Hanging Man candlestick is a bearish reversal pattern that appears after an uptrend, signaling that…