

Support and resistance are among the most important concepts in technical analysis. Almost every professional trader uses support and resistance levels to identify entry and exit points in the market.
Whether you trade forex, stocks, crypto, or indices, understanding how support and resistance work can significantly improve your trading decisions.
In this guide, you will learn what support and resistance are, how to identify them, and how to use them in a profitable trading strategy.
What is Support in Trading?
Support is a price level where a downtrend tends to stop because buying pressure becomes stronger than selling pressure.
When the price reaches a support level, traders expect the market to bounce upward.
Example
If EUR/USD repeatedly falls to 1.1000 and then moves upward, that level becomes a support level.
Key Characteristics of Support
• Price tends to bounce upward
• Buyers enter the market
• Downtrend may pause or reverse
• Strong support levels are tested multiple times
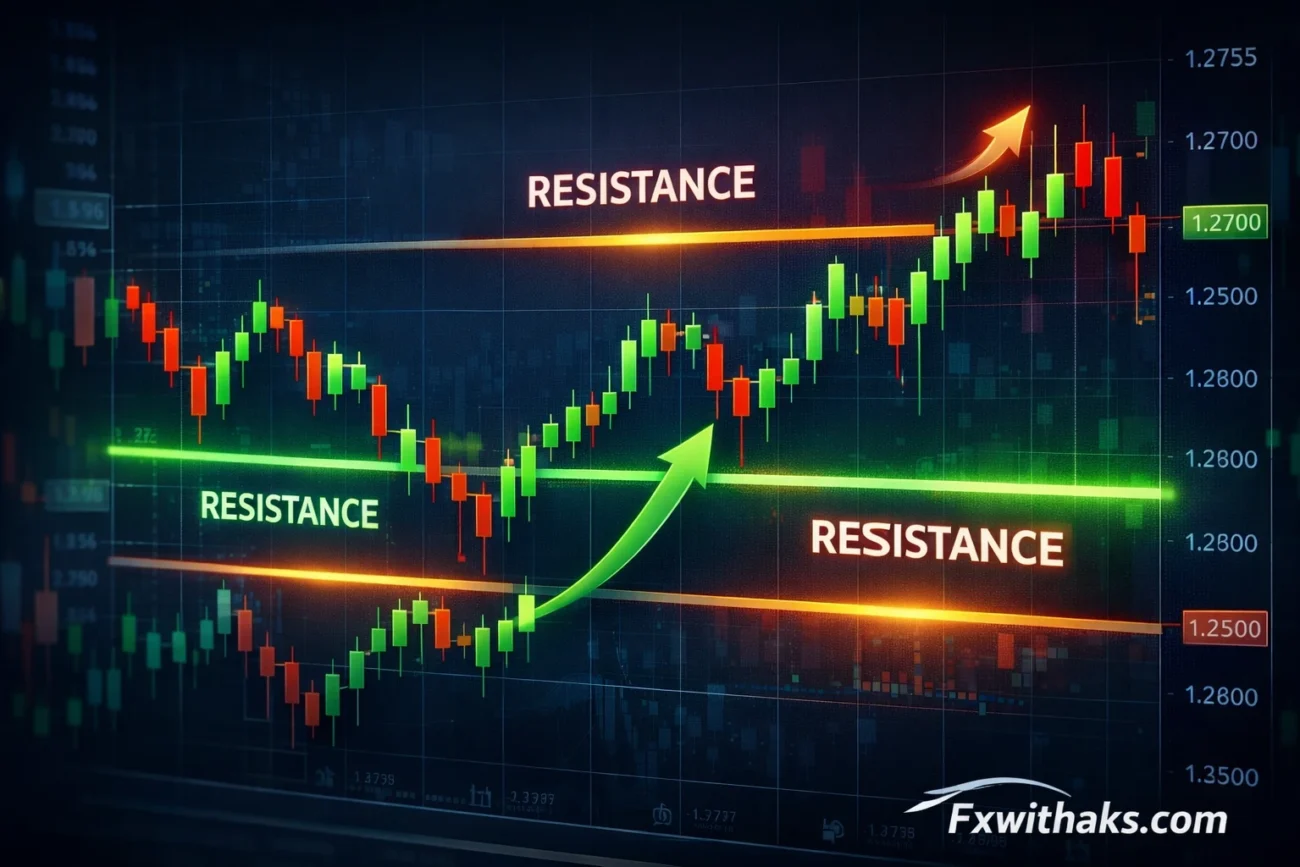
What is Resistance in Trading?
Resistance is a price level where an uptrend tends to stop because selling pressure becomes stronger than buying pressure.
When the price reaches resistance, traders expect the market to move downward.
Example
If GBP/USD repeatedly rises to 1.2800 and then drops, that level becomes resistance.
Key Characteristics of Resistance
• Price tends to fall from this level
• Sellers dominate the market
• Uptrend slows down or reverses
• Multiple rejections strengthen resistance
How to Identify Support and Resistance Levels
There are several methods traders use to identify support and resistance levels.
1. Previous Highs and Lows
The simplest method is identifying previous swing highs and swing lows.
• Previous lows = Support
• Previous highs = Resistance
These levels show where price reacted strongly in the past.
2. Psychological Price Levels
Round numbers like:
• 1.2000
• 1.3000
• 100.00
often act as strong support and resistance levels because many traders place orders there.
3. Trendlines
Trendlines can also act as dynamic support and resistance.
• Uptrend line = Support
• Downtrend line = Resistance
They help traders understand market direction.
4. Moving Averages
Indicators like 50 EMA or 200 EMA often act as dynamic support and resistance.
Price frequently bounces off these levels in trending markets.
Support and Resistance Trading Strategy
Now let’s look at a simple and powerful strategy using these levels.
Strategy 1: Bounce Trading
This strategy involves trading the bounce from support or resistance.
Buy Setup
- Price reaches support level
- Bullish candlestick pattern appears
- Enter a buy trade
- Stop loss below support
- Take profit near resistance
Sell Setup
- Price reaches resistance
- Bearish candlestick pattern appears
- Enter a sell trade
- Stop loss above resistance
- Take profit near support
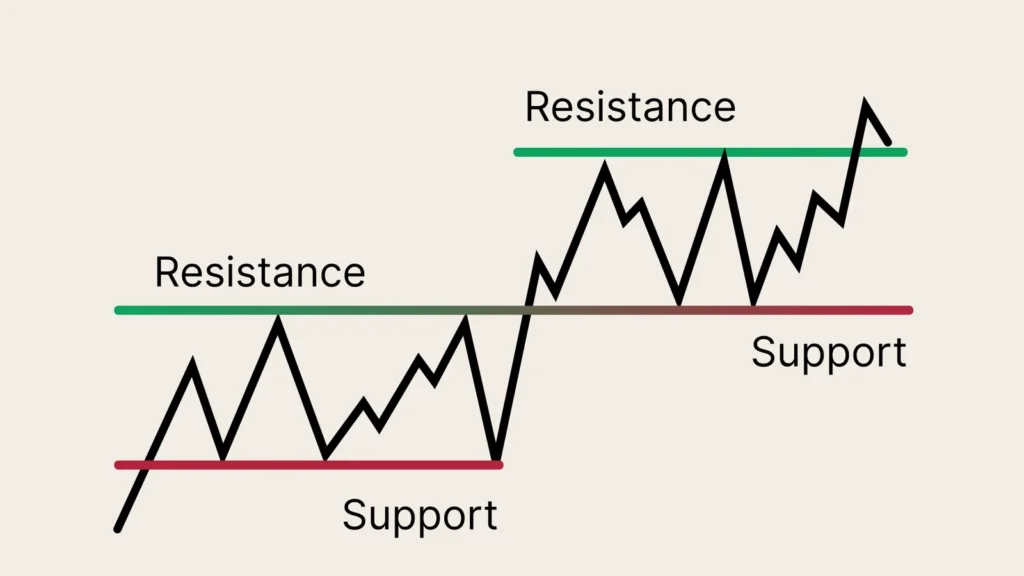
Strategy 2: Breakout Trading
Sometimes price breaks support or resistance with strong momentum.
Breakout Buy
- Price breaks resistance
- Candle closes above resistance
- Enter buy trade
- Stop loss below breakout level
Breakout Sell
- Price breaks support
- Candle closes below support
- Enter sell trade
- Stop loss above support
Breakouts often lead to strong trends.
Tips for Trading Support and Resistance
Follow these tips to improve your trading results.
Wait for Confirmation
Never trade levels blindly. Always wait for confirmation such as:
• Candlestick patterns
• Volume increase
• Breakout candle close
Use Multiple Timeframes
Check support and resistance on higher timeframes like:
• Daily
• 4H
• 1H
Higher timeframe levels are usually stronger.
Combine with Other Indicators
Support and resistance work best when combined with:
• RSI
• Moving averages
• Price action patterns
Common Mistakes Traders Make
Many beginners misuse support and resistance levels.
1. Drawing Too Many Levels
Keep charts clean. Focus only on major levels.
2. Ignoring Market Trend
Trading against strong trends can be risky.
3. Entering Without Confirmation
Always wait for price reaction.
Why Support and Resistance Work
Support and resistance levels work because they reflect market psychology.
At support:
Buyers believe the price is cheap.
At resistance:
Sellers believe the price is expensive.
This creates repeated price reactions.
Final Thoughts
Support and resistance are essential tools for every trader. They help identify high-probability trading opportunities and manage risk effectively.
By practicing how to identify these levels and combining them with proper confirmation signals, traders can significantly improve their trading performance.
Consistency and patience are key when using support and resistance strategies.