

The Tweezer Top is a bearish candlestick reversal pattern that appears after an uptrend, signaling that the upward momentum might be weakening and a potential trend reversal is coming.

🔥 Tweezer Top Pattern Structure
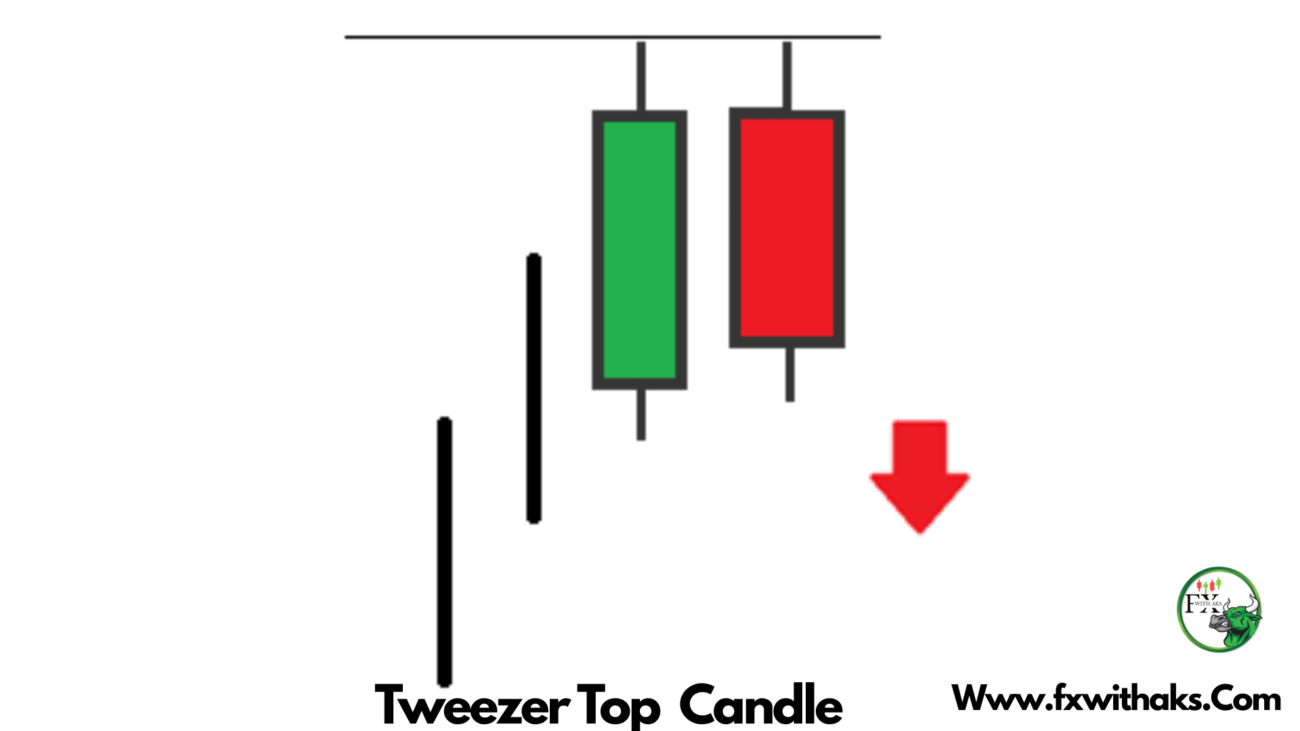
It consists of two candles:
- First Candle
- Bullish (green or white)
- Continues the existing uptrend
- Has a high wick or upper shadow
- Second Candle
- Bearish (red or black)
- Opens around the same level the previous candle closed
- High matches or is very close to the high of the first candle
- Shows rejection of higher prices
📉 What It Indicates
- Buyers pushed the price up, but failed to go beyond a certain level twice in a row.
- Sellers stepped in on the second candle with enough strength to stop the uptrend.
- It signals a potential bearish reversal.

🛠️ How to Use It in Trading
| Action | How to Apply |
|---|---|
| Exit Long Positions | Use it as a warning that the uptrend may be ending. |
| Enter Short Trades | After confirmation from the next candle (e.g. a bearish follow-through). |
| Set Stop-Loss | Just above the high of the Tweezer Top. |
| Combine With | RSI (overbought), MACD, volume spikes, resistance levels |
How To Trade With Tweezer Top Candle
Trading with the Tweezer Top candlestick pattern can be a great way to spot potential bearish reversals — especially when combined with other tools. Here’s a step-by-step guide on how to do it:

📌 1. Identify the Pattern
- Look for it at the top of an uptrend
- Two candles with matching or nearly matching highs
- First candle: bullish
- Second candle: bearish, often showing rejection of the same high
🧠 Tip: The more similar the highs and the stronger the bearish second candle, the better.
📊 2. Confirm the Reversal
To avoid false signals, combine with:
- RSI above 70 → overbought conditions
- MACD bearish crossover
- Resistance level or Fibonacci level
- Bearish volume spike on the second candle
📉 Look for a third candle that closes lower — this acts as confirmation.
💼 3. Entry Strategy
| Scenario | Entry Point |
|---|---|
| Conservative | Enter on the next candle after the Tweezer Top, only if it closes lower |
| Aggressive | Enter at the close of the second (bearish) candle |

🛡️ 4. Stop-Loss Placement
- Place your stop-loss just above the high of the Tweezer Top
- This keeps your risk controlled in case of a fakeout
🎯 5. Set Profit Targets
- First target: recent support level or swing low
- Second target (optional): use Fibonacci retracements or a trailing stop for extended moves
🧮 Example:
- Price is trending up
- Tweezer Top forms at a key resistance zone
- RSI is above 70
- You enter short at the next candle’s open
- Stop above the highs, target previous support
Would you like a visual chart setup or a backtested strategy based on this pattern?