Here’s a Complete Guide to Candlestick Patterns, categorized into bullish, bearish, and continuation patterns. These patterns help traders analyze market sentiment and predict future price movements.

1. Bullish Reversal Patterns (Indicate a potential trend reversal from downtrend to uptrend)
a) Single-Candle Patterns
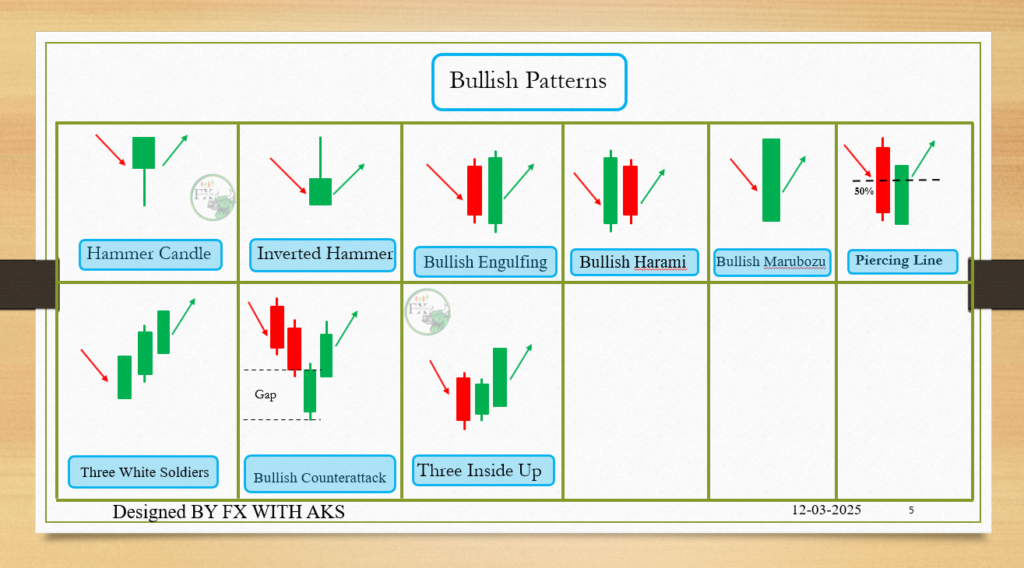
- Hammer 🛠️ – A small body with a long lower wick, signaling a potential reversal after a downtrend.
- Inverted Hammer – Similar to a hammer but with a long upper wick, suggesting a reversal.
- Doji – A candle with a tiny or non-existent body, indicating indecision but potential reversal when at the bottom of a trend.
b) Multi-Candle Patterns
- Bullish Engulfing – A large bullish candle engulfs the previous bearish candle, signaling strong buying pressure.
- Piercing Line – A two-candle pattern where the second bullish candle closes above the midpoint of the previous bearish candle.
- Morning Star – A three-candle pattern with a bearish candle, a small indecisive candle (doji/spinning top), and a strong bullish candle.
- Three White Soldiers – Three consecutive bullish candles, each closing higher, indicating strong bullish momentum.
2. Bearish Reversal Patterns (Indicate a potential trend reversal from uptrend to downtrend)
a) Single-Candle Patterns
- Shooting Star ⭐ – A small-bodied candle with a long upper wick, signaling a potential bearish reversal.
- Gravestone Doji – Similar to a shooting star, but with an almost non-existent body, indicating strong rejection of higher prices.
b) Multi-Candle Patterns
- Bearish Engulfing – A large bearish candle engulfs the previous bullish candle, showing strong selling pressure.
- Dark Cloud Cover – A two-candle pattern where the second bearish candle closes below the midpoint of the previous bullish candle.
- Evening Star – A three-candle pattern with a bullish candle, a small doji/spinning top, and a strong bearish candle.
- Three Black Crows – Three consecutive bearish candles, each closing lower, signaling strong bearish momentum.
3. Continuation Patterns (Indicate trend continuation rather than reversal)
a) Indecision Candles
- Spinning Top – A small body with long upper and lower wicks, indicating market indecision.
- Doji Variants (Standard, Long-Legged, Dragonfly, Gravestone) – Indicate hesitation in the market.
b) Multi-Candle Continuation Patterns
- Rising Three Methods – A large bullish candle, followed by three smaller bearish candles, then another strong bullish candle.
- Falling Three Methods – A large bearish candle, followed by three smaller bullish candles, then another strong bearish candle.
- Mat Hold – A variation of the “Three Methods” pattern, signaling a continuation.
How to Use Candlestick Patterns in Trading
- Confirm with Indicators – Use RSI, MACD, moving averages, or Bollinger Bands to strengthen signals.
- Check Volume – Higher volume during pattern formation increases its reliability.
- Identify Key Levels – Look for support/resistance levels to validate patterns.
- Avoid False Signals – Wait for confirmation rather than trading immediately.
BY FX WITH AKS –

40 Powerful Candlestick Patterns: A Complete Trading Guide for Beginner Traders
📈 Bullish Candlestick Patterns
- Hammer
- Inverted Hammer
- Bullish Engulfing
- Piercing Line
- Morning Star
- Three White Soldiers
- Bullish Harami
- Tweezer Bottom
- Bullish Counterattack
- Bullish Marubozu
- Dragonfly Doji
- Bullish Kicker
- Rising Three Methods
- Bullish Abandoned Baby
📉 Bearish Candlestick Patterns
- Hanging Man
- Shooting Star
- Bearish Engulfing
- Dark Cloud Cover
- Evening Star
- Three Black Crows
- Bearish Harami
- Tweezer Top
- Bearish Counterattack
- Bearish Marubozu
- Gravestone Doji
- Bearish Kicker
- Falling Three Methods
- Bearish Abandoned Baby
🔄 Continuation / Neutral Patterns
- Doji
- Long-Legged Doji
- Spinning Top
- Four Price Doji
- Inside Bar
- Outside Bar
- Side-by-Side White Lines
- Upside Tasuki Gap
- Downside Tasuki Gap
- Mat Hold Pattern
- High Wave Candle
- Rickshaw Man


Very good 👌