
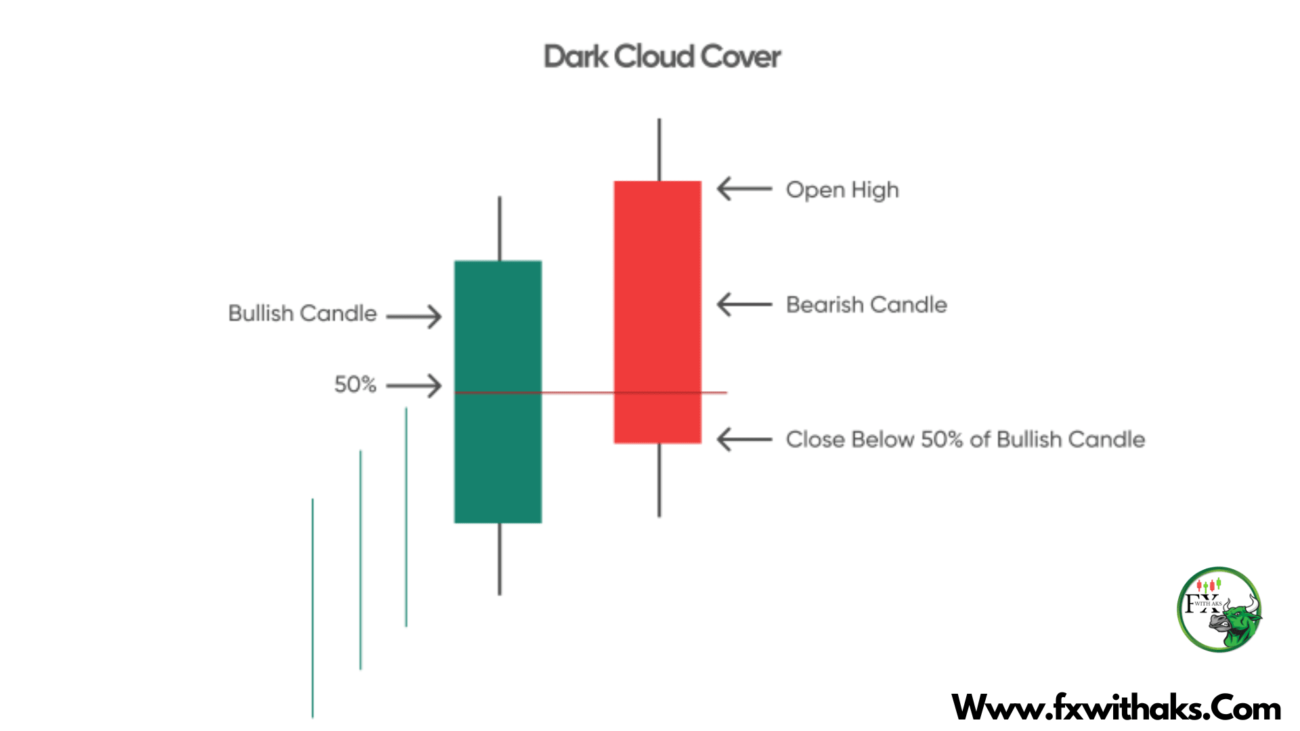
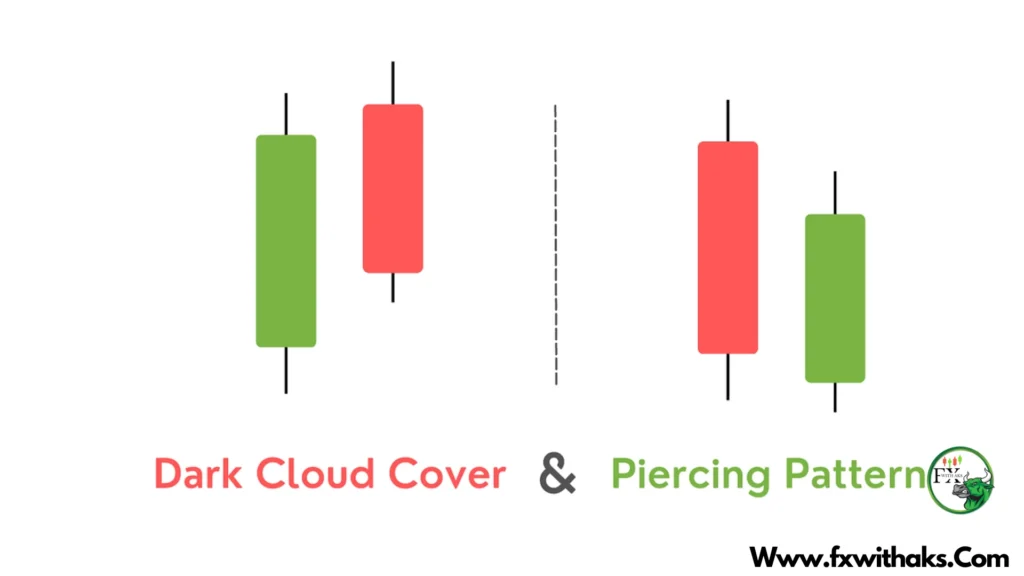
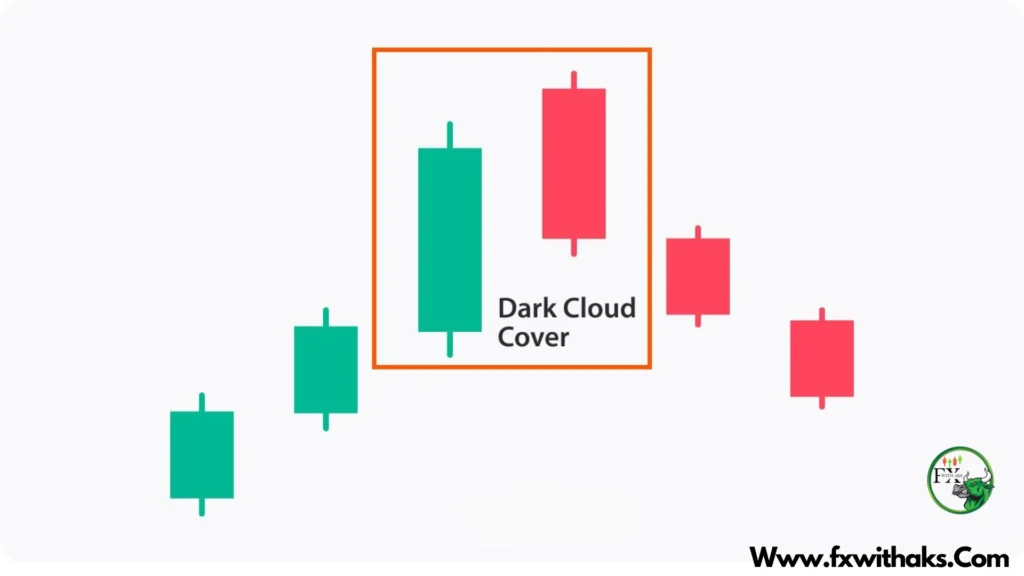
The Dark Cloud Cover is a classic bearish reversal candlestick pattern that signals a potential shift from an uptrend to a downtrend. It’s like a warning that the bullish party might be over.
🌩️ What is a Dark Cloud Cover?
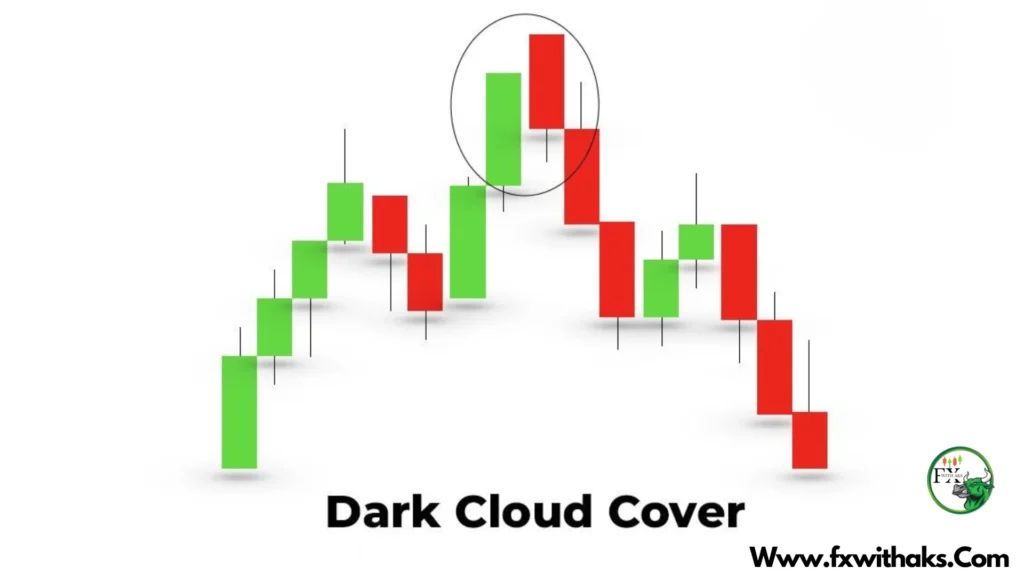
🔍 Pattern Characteristics:
- Appears after an uptrend
- First candle is a strong bullish candle (green/white)
- Second candle is bearish (red/black) that:
- Opens above the high of the previous candle (gap up)
- Closes below the midpoint of the first candle
This shows that buyers tried to push higher, but sellers came in strong and reversed the momentum.
🔻 What It Tells You
- Bullish momentum is fading
- Sellers are taking control
- A potential trend reversal could follow
📉 How to Trade the Dark Cloud Cover
1. Identify the Setup
- Occurs after a solid uptrend or rally
- Pattern must match the structure above
- Stronger if near a resistance level or Fibonacci zone
2. Confirm the Pattern
Use confirmation before entering a trade:
✅ Next candle closes lower
✅ Volume spike on the bearish candle
✅ Bearish signals from RSI, MACD, or Stochastic
✅ Price fails to break above recent highs
3. Entry Point
📌 Aggressive Entry:
Enter short at the close of the Dark Cloud Cover candle
📌 Conservative Entry:
Wait for the next candle to break the low of the Dark Cloud candle
4. Stop Loss
🛑 Place your stop loss:
- Just above the high of the pattern
- Or just above a nearby resistance level
5. Profit Targets
🎯 Set targets based on:
- Nearest support levels
- Trendlines or previous swing lows
- Use a 1:2 or better risk-to-reward ratio
🧠 Pro Tips:
- Combine with other tools like trendlines, moving averages, or volume analysis
- Avoid in sideways/choppy markets
- Best on higher timeframes (1H, 4H, Daily) for reliable setups
Want me to generate a chart example or visual for the Dark Cloud Cover?