


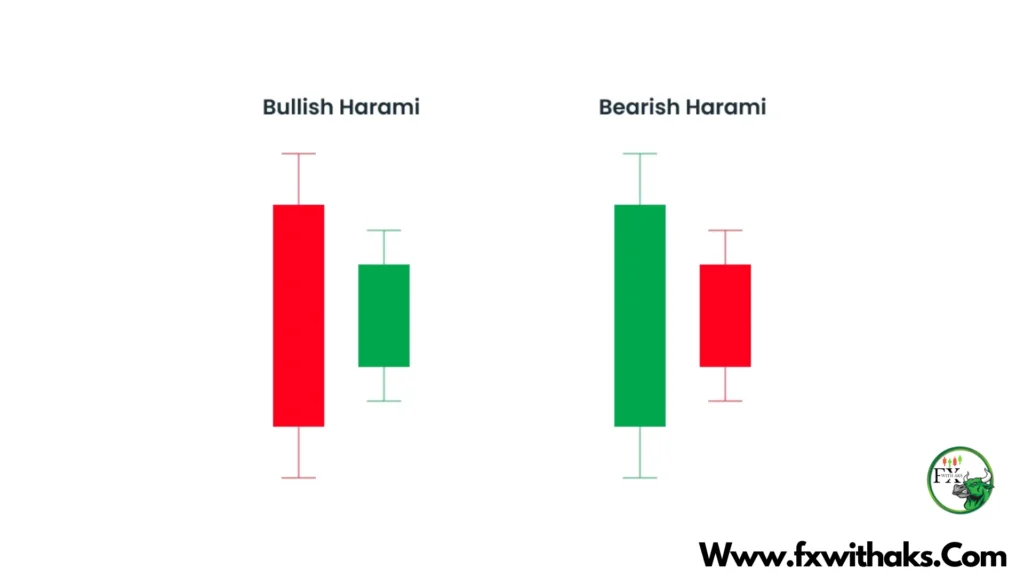
A Bearish Harami is a two-candle chart pattern used in technical analysis, commonly seen as a potential reversal signal from a bullish trend to a bearish one. It gets its name from the Japanese word “harami,” meaning “pregnant,” as the pattern visually resembles a smaller candlestick “inside” a larger one.
📉 Bearish Harami Pattern Breakdown:
- First Candle (Bullish):
- Long green (or white) candlestick.
- Indicates strong upward momentum.
- Second Candle (Bearish or Doji):
- Small red (or black) candlestick.
- Completely contained within the body of the first candle.
- It can be bearish or a doji (indicating indecision).
🔍 Key Characteristics:
- The second candle does not need to close lower than the first, just inside the body.
- It suggests that buying pressure is weakening.
- More reliable when it appears after a strong uptrend.
✅ Confirmation:
To increase reliability, traders usually wait for a third candle that confirms the bearish move — like a red candle that closes lower than the second candle.
📊 Example:
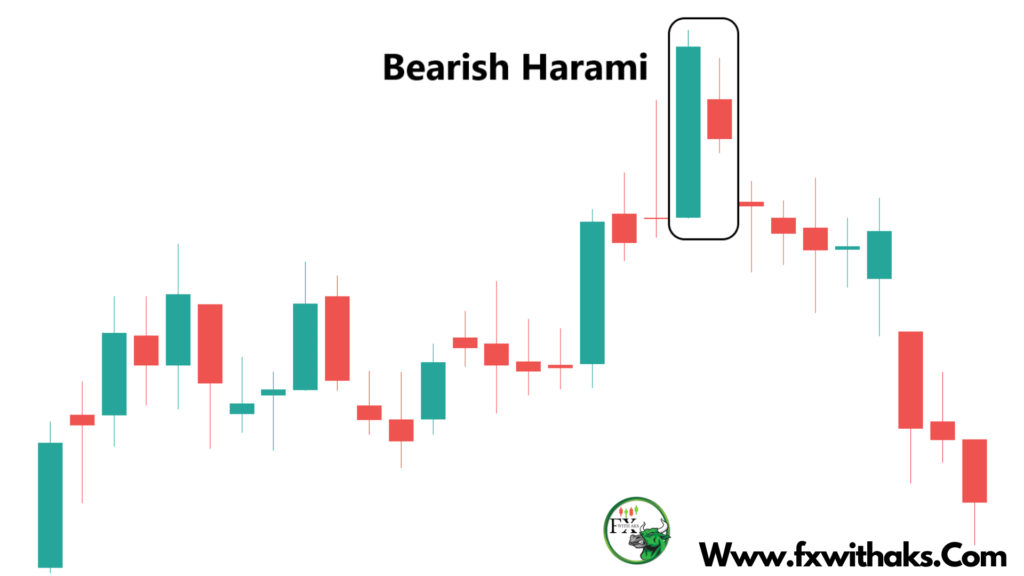
Let’s say you see this on a chart:
- Day 1: Big green candle, price moves from $100 to $110.
- Day 2: Small red candle, price opens at $109 and closes at $107.
This could be a Bearish Harami — a warning that the uptrend may be losing steam.
Want me to show you an example chart or code to detect it automatically in a dataset?
Trading with a Bearish Harami pattern is all about recognizing the potential shift in momentum and managing your risk wisely. Here’s a step-by-step guide you can follow:
📉 How to Trade a Bearish Harami Pattern
1. Identify the Pattern
Make sure the conditions are met:
- There’s a clear uptrend before the pattern.
- The first candle is large and bullish.
- The second candle is small and bearish (or a doji), and its body is completely within the first candle’s body.
2. Wait for Confirmation
A common mistake is entering too early. Look for:
- A third candle that closes below the second candle.
- Increased volume can strengthen confirmation.
- You can also use technical indicators like RSI or MACD to confirm overbought conditions.
✅ Entry Signal:
- Enter a short position (or sell) once the price breaks below the second candle’s low.
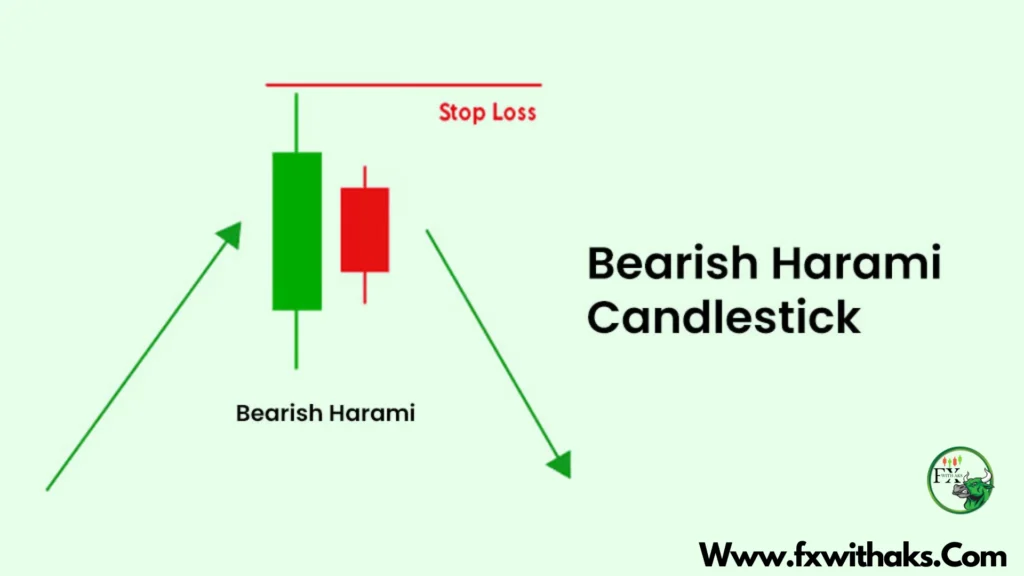
3. Set a Stop Loss
Protect yourself from false signals.
🔒 Where to place it:
- Just above the high of the first (bullish) candle.
4. Set a Profit Target
Aim for a reward-to-risk ratio of at least 2:1.
🎯 Options:
- Use support levels to decide your exit.
- Or use a trailing stop to follow the price downward.
5. Optional: Use with Other Indicators
- RSI: Overbought (above 70) supports bearish bias.
- MACD: A bearish crossover adds confidence.
- Volume: Low volume on the second candle + higher volume on the breakdown = stronger signal.
📌 Example Trade Setup
| Action | Price Level |
|---|---|
| Entry | Below 2nd candle’s low |
| Stop Loss | Above 1st candle’s high |
| Take Profit | Nearest support / 2x risk |
Would you like:
- A visual example/chart?
- Code to scan for this pattern in a dataset?
- Or examples from current stock charts?
One thought on “Bearish Harami Candle – Definition , How To Trade”