A Hammer candlestick is a bullish reversal pattern that typically appears at the bottom of a downtrend. It signals a potential trend reversal to the upside. Here are the key characteristics of a Hammer candlestick.

Characteristics of a Hammer Candlestick:
- Small Body – The real body (difference between open and close price) is small and located near the top of the candlestick.
- Long Lower Shadow – The lower wick (shadow) is at least twice the size of the real body.
- Little or No Upper Shadow – There is either no upper wick or a very small one.
- Color Can Vary – While both green (bullish) and red (bearish) Hammers exist, a green Hammer is considered a stronger bullish signal.
What the Hammer Indicates:
- The long lower shadow shows that sellers drove the price lower during the session.
- However, buyers stepped in aggressively, pushing the price back up before the close.
- This signals a potential shift in momentum from bearish to bullish.
Hammer vs. Hanging Man:
- If a Hammer appears at the bottom of a downtrend, it’s bullish.
- If the same pattern appears at the top of an uptrend, it’s called a Hanging Man and could indicate a bearish reversal.
Confirmation for a Stronger Signal:
- A Hammer is more reliable when followed by a bullish confirmation candle (e.g., a strong green candle closing above the Hammer).
- It is best used in combination with volume analysis, support levels, or other technical indicators (like RSI or MACD).
Would you like a chart example or a real-time analysis of a stock/chart?
🏦 SIP আসলে কী? (সহজ ভাষায়) খুব সহজভাবে বললে, SIP হলো একটি জমানোর পদ্ধতি। যেমন আমরা……
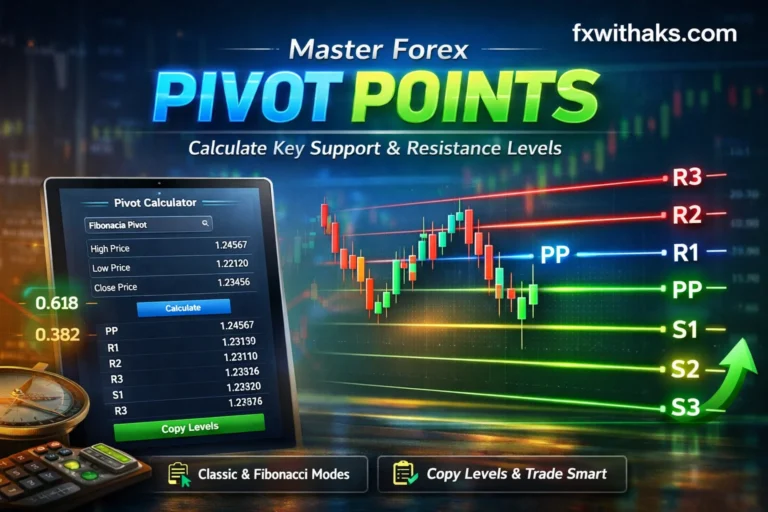
Pivot Point Calculator Our Pivot Point Calculator is a powerful trading tool designed to help…
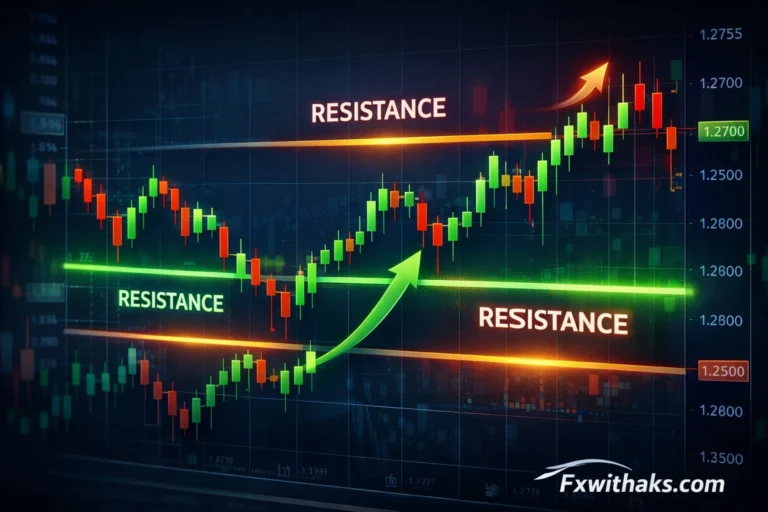
Support and resistance are among the most important concepts in technical analysis. Almost every…
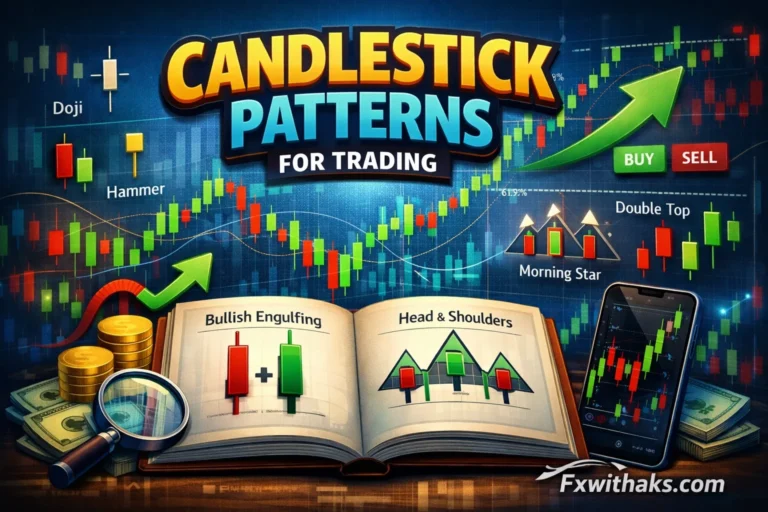
Candlestick patterns are one of the most important tools used in trading. They help traders…
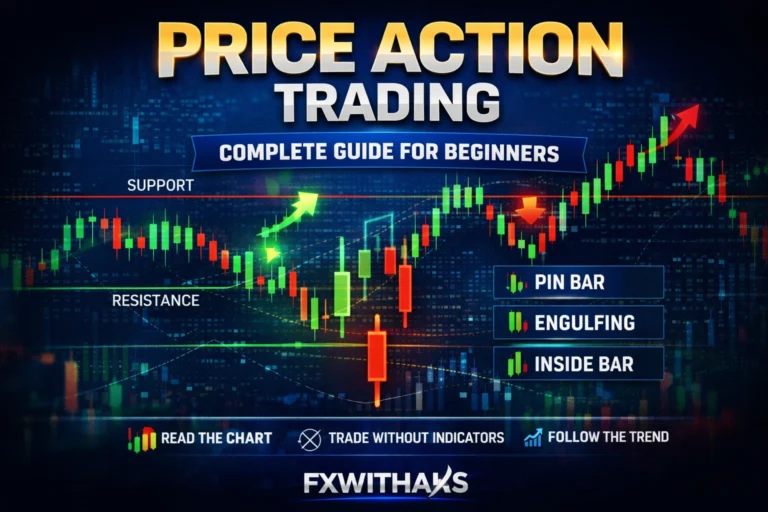
Price Action Trading is one of the most popular trading methods used by professional traders…
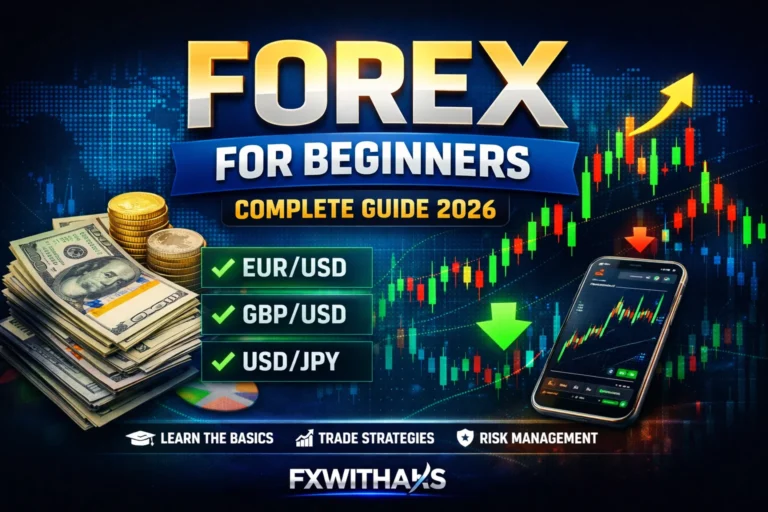
Learn Forex Trading from Scratch | FXWITHAKS Forex trading is one of the largest financial…

Forex Regulatory Organizations – Top Global Forex Regulators Below is a fully SEO-optimized blog…
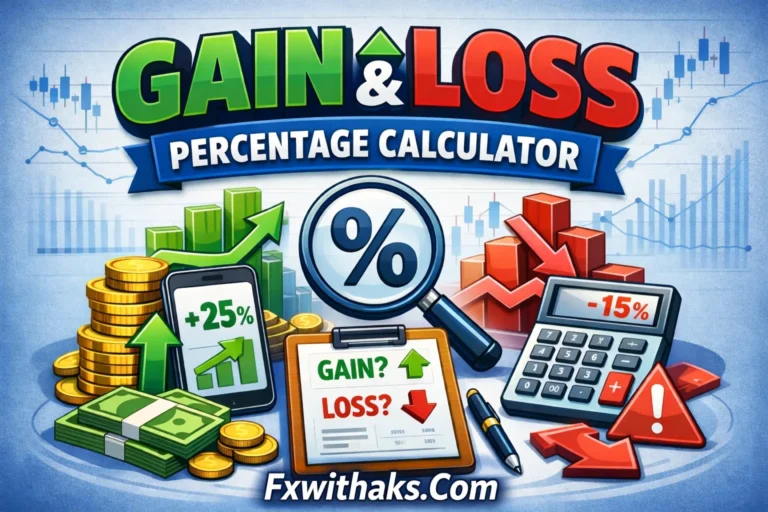
A Gain & Loss Percentage Calculator helps you find the percentage increase (gain) or decrease…
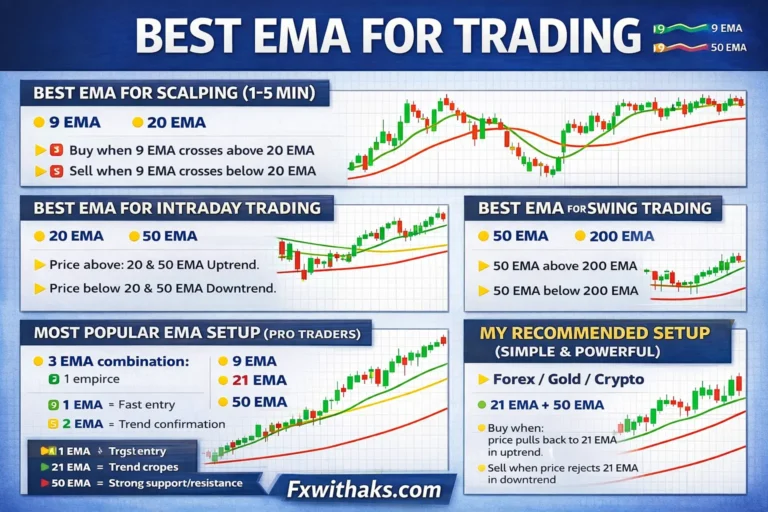
EMA (Exponential Moving Average) reacts faster to price than a normal moving average, which makes…
One thought on “What is Hammer Candlesticks Pattern – How To Trade”