

The Three Outside Up candlestick pattern is a bullish reversal pattern that typically appears after a downtrend. It signals a potential shift from bearish to bullish momentum and consists of three candlesticks.
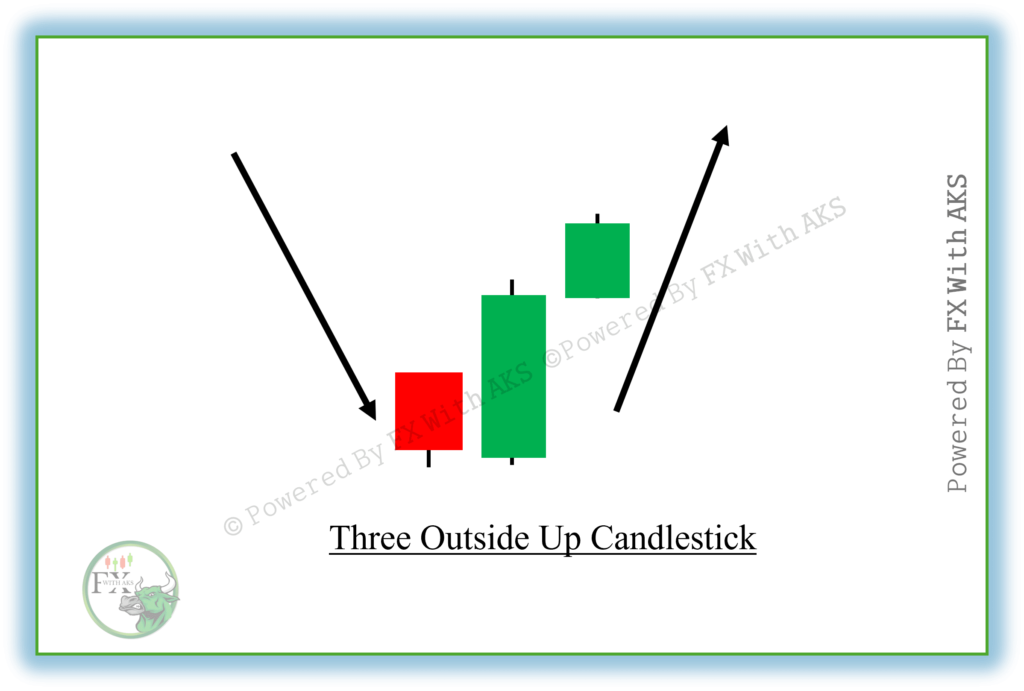
🔺 Three Outside Up (Bullish Reversal)
✅ Structure:
- First Candle: Bearish (red), shows the current downtrend
- Second Candle: Bullish engulfing candle – it fully engulfs the first candle’s body
- Third Candle: Another bullish candle closing higher than the second candle
🔍 Meaning:
- First candle shows the existing selling trend
- Second candle signals a strong shift in sentiment (bullish engulfing)
- Third candle confirms the reversal with follow-through buying
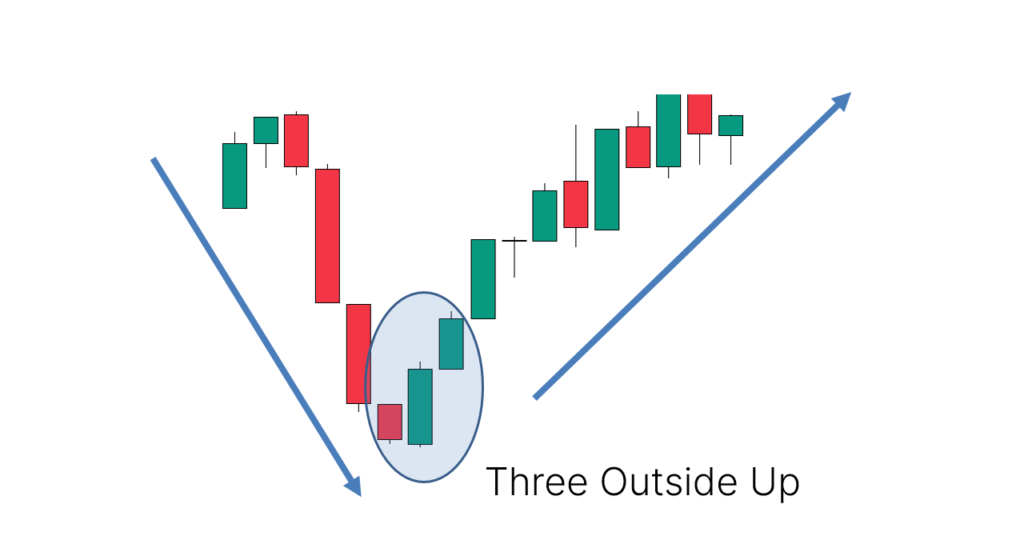
📈 Use Case:
- Appears at the end of a downtrend
- Signals a bullish reversal
- Stronger if occurs near a support zone
🎯 Trading Strategy:
- Entry: At the close of the third candle, or break above its high
- Stop-Loss: Below the low of the first candle
- Target: Nearby resistance or Fibonacci level
🔻 Three Outside Down (Bearish Reversal)
✅ Structure:
- First Candle: Bullish (green), shows the current uptrend
- Second Candle: Bearish engulfing – fully engulfs the first candle’s body
- Third Candle: Another bearish candle closing lower than the second candle
🔍 Meaning:
- First candle continues the existing bullish trend
- Second candle shows a strong shift to bearish control
- Third candle confirms the reversal with continued selling
📉 Use Case:
- Appears at the top of an uptrend
- Signals a bearish reversal
- Stronger if it forms near resistance
🎯 Trading Strategy:
- Entry: At the close of the third candle, or break below its low
- Stop-Loss: Above the high of the first candle
- Target: Next support level or a measured move
🧠 Pro Tips
- Use volume confirmation: higher volume on second or third candle is more convincing
- Combine with trendline breaks or oscillator divergence
- Look for patterns on H1, H4, or daily timeframes for stronger signals
Best EMA for Trading – Simple & Practical Guide for Traders
EMA (Exponential Moving Average) reacts faster to price than a normal moving average, which makes…
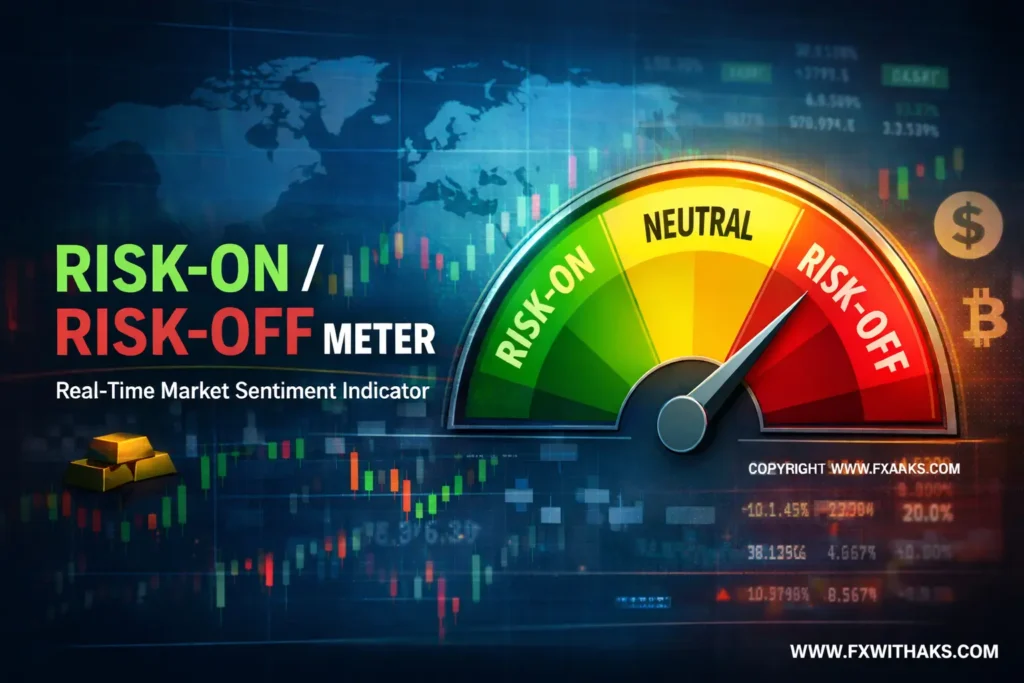
Risk-On / Risk-Off Meter – Real Time Market Sentiment
A Real-Time Snapshot of Global Market SentimentFinancial markets constantly rotate between Risk-On and Risk-Off conditions….
Forex Poster Maker -Accurate Forex Buy/Sell Signals
Create professional forex posters instantly! Get precise buy/sell signals for major currency pairs, crypto, metals,…
Free Forex Profit/Loss Calculator | Accurate Pips & pl Calculation
A precise profitability tool designed for business owners and analysts. Enter revenue, COGS, fixed/variable costs,…

Gold Price Seasonality Chart 10 Year XAU/USD
XAUUSD Gold Seasonality Bar Chart (Last 10 Years) Gold (XAUUSD) – 10-Year Seasonality Gold Price…
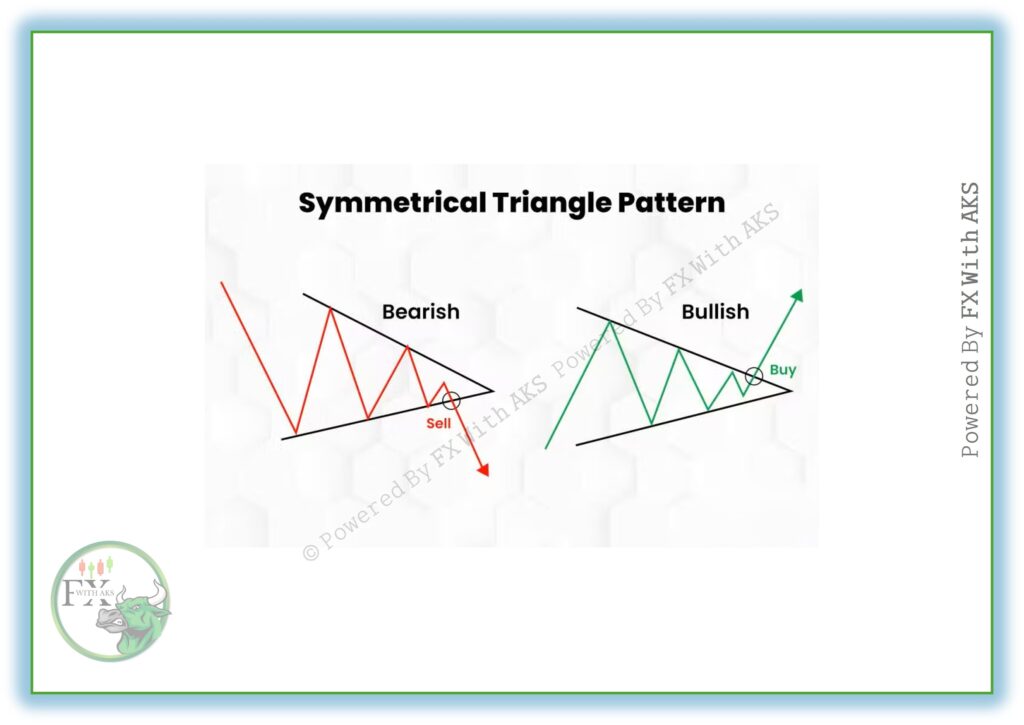
Symmetrical Triangle Pattern in Trading – How to Trade Breakouts | FXWithAKS
A Symmetrical Triangle is a chart pattern that appears when the market is consolidating, and…