


The Bullish Harami is a two-candlestick pattern that suggests a potential reversal from a downtrend to an uptrend.
It is considered a bullish signal in technical analysis and often appears at the bottom of a downtrend.

Characteristics of a Bullish Harami:
- First Candle (Bearish): A large red (bearish) candlestick that continues the current downtrend.
- Second Candle (Bullish): A small green (bullish) candlestick that is completely within the body of the previous red candle.
- Gap or No New Low: The second candle opens higher than the previous close (or very close to it) and remains small, indicating a slowdown in selling pressure.
Meaning & Psychology Behind the Pattern:
- The large bearish candle suggests strong selling pressure.
- The small bullish candle within the previous candle’s range indicates that selling momentum is weakening.
- If followed by a confirmation candle (a bullish close after the pattern), it suggests that buyers are stepping in.
Trading Strategy:
- Entry: Traders usually wait for confirmation with a bullish candle after the pattern.
- Stop-Loss: Placed below the low of the pattern.
- Target: Can be set at previous resistance levels or based on risk-reward ratio.
Would you like a visual representation or more details on how to use it in trading strategies?

EMA (Exponential Moving Average) reacts faster to price than a normal moving average, which makes…
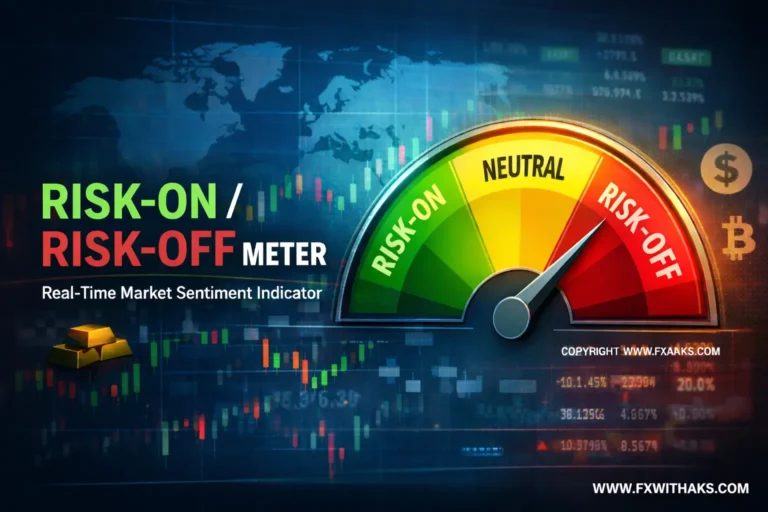
A Real-Time Snapshot of Global Market SentimentFinancial markets constantly rotate between Risk-On…
Create professional forex posters instantly! Get precise buy/sell signals for major currency pairs…
A precise profitability tool designed for business owners and analysts. Enter revenue, COGS…
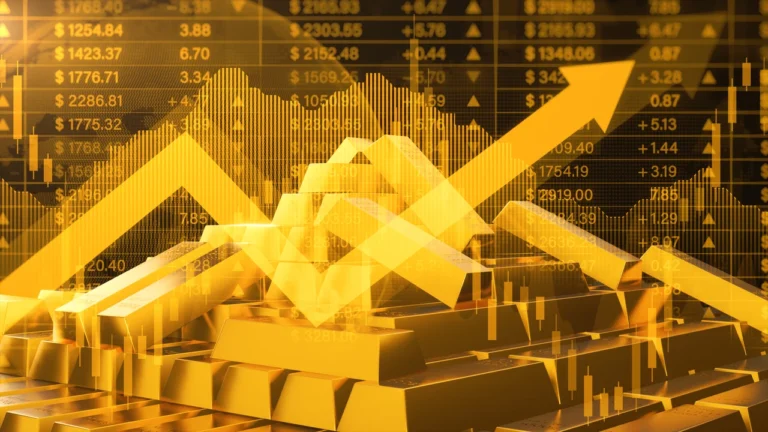
XAUUSD Gold Seasonality Bar Chart (Last 10 Years) Gold (XAUUSD) – 10-Year Seasonality Gold Price…
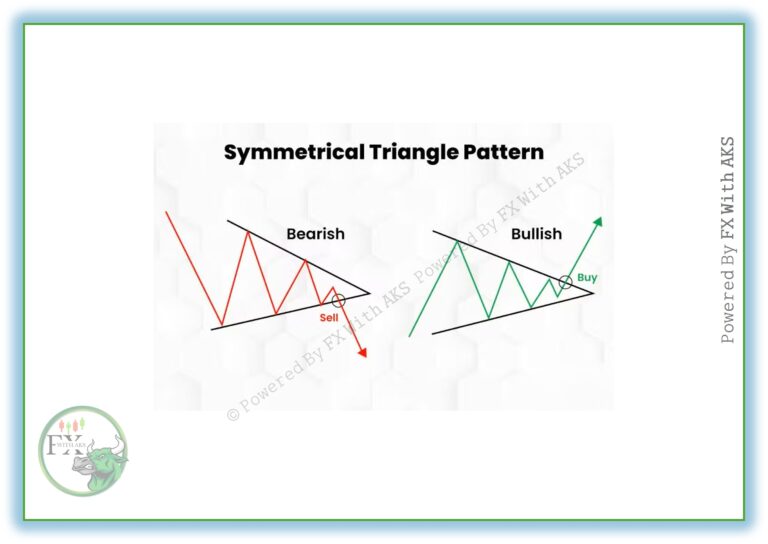
A Symmetrical Triangle is a chart pattern that appears when the market is consolidating, and…

Take control of your risk management with our advanced Position Size Calculator. Whether…

A Pip Calculator in trading is a tool used to determine the monetary value of a……
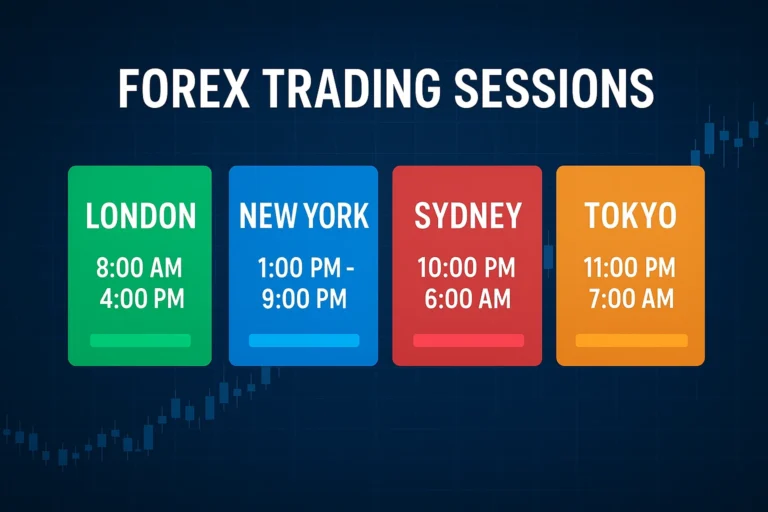
Learn the four major forex trading sessions , Forex Market Time Zone Converter – Sydney…
One thought on “How To Trade Bullish Harami Candlestick”