


The Bullish Engulfing pattern is a strong bullish reversal pattern that appears after a downtrend, signaling a potential shift in market sentiment from bearish to bullish.
Bullish Engulfing Pattern : Definition Formation In Trading
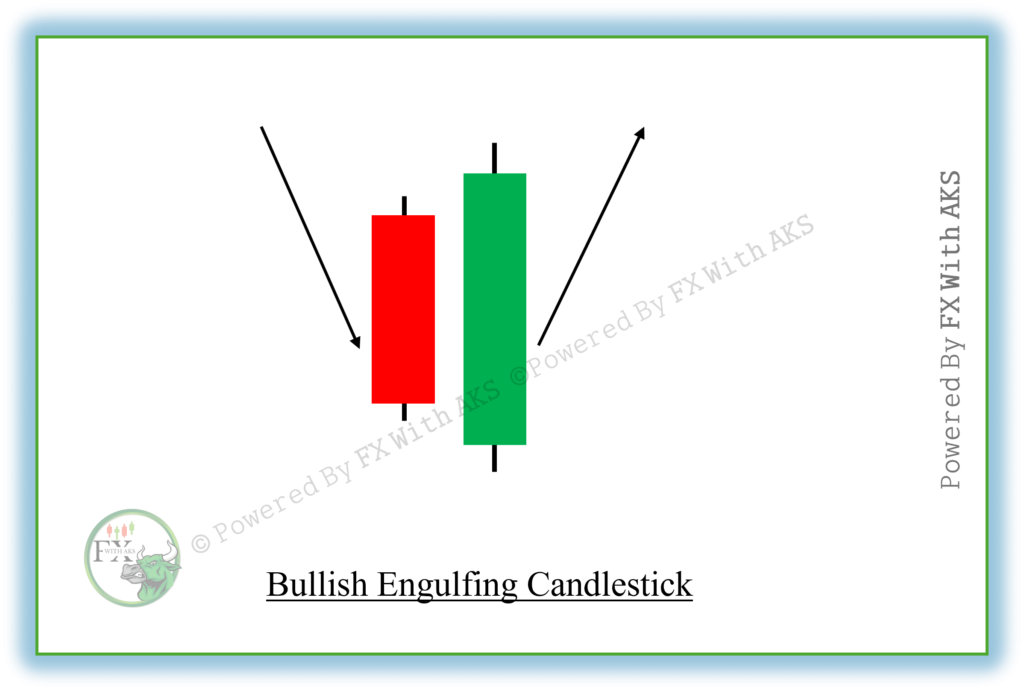
Key Characteristics of a Bullish Engulfing Pattern:
- Two Candlestick Pattern – It consists of two candles:
- The first candle is bearish (red) and relatively small.
- The second candle is bullish (green) and significantly larger.
- Full Engulfing – The body of the second candle completely engulfs the body of the first candle.
- Appears After a Downtrend – It forms at the bottom of a downtrend, signaling a reversal.
- The Close is Higher Than the Open of the First Candle – Showing strong buying pressure.
What the Bullish Engulfing Pattern Signals:
- The first bearish candle shows selling pressure.
- The second, much larger bullish candle signals strong buying momentum, overpowering the sellers.
- If confirmed by the next candle closing higher, it indicates a potential trend reversal.

How to Trade the Bullish Engulfing Pattern:
Trading the Bullish Engulfing pattern can be a high-probability strategy when used with proper context and confirmation. Here’s how to trade it effectively:
📈 What is a Bullish Engulfing Pattern?
A Bullish Engulfing is a two-candle pattern that signals potential reversal from bearish to bullish.
🔍 Pattern Characteristics:
- Appears after a downtrend or pullback.
- The first candle is bearish (small red/black).
- The second candle is bullish (large green/white) and completely engulfs the first candle’s body.
- Shows a strong shift in momentum from sellers to buyers.
✅ How to Trade the Bullish Engulfing Pattern
1. Identify the Pattern
Look for the two-candle formation:
- After a downtrend or consolidation
- Second candle’s body fully engulfs the first candle’s body
2. Add Confirmation
Use these tools to confirm the strength of the pattern:
✔️ Volume: Higher volume on the second candle = stronger signal
✔️ Support zone: Pattern forms at or near a key support level
✔️ Indicators: Bullish divergence on RSI, Stochastic, MACD crossover
✔️ Follow-up candle: Next candle closes higher to confirm bullish momentum
3. Entry Point
📌 Aggressive Entry:
Enter at the close of the bullish engulfing candle
📌 Conservative Entry:
Wait for the next candle to break above the high of the engulfing candle
4. Stop Loss Placement
🛑 Place your stop loss:
- Just below the low of the engulfing pattern
- Or below a nearby support level if it’s tighter
5. Profit Targets
🎯 Set targets based on:
- Previous resistance levels
- Fibonacci retracement levels
- Risk:Reward ratio (aim for 1:2 or better)
🧠 Bonus Trading Tips:
- Works best on higher timeframes (1H, 4H, Daily) for more reliable signals
- Look for patterns at key support zones
- Combine with trendlines or moving averages to strengthen setups
Want a chart example or visual breakdown of the setup?

One thought on “Bullish Engulfing Candle Pattern – How To Trade”