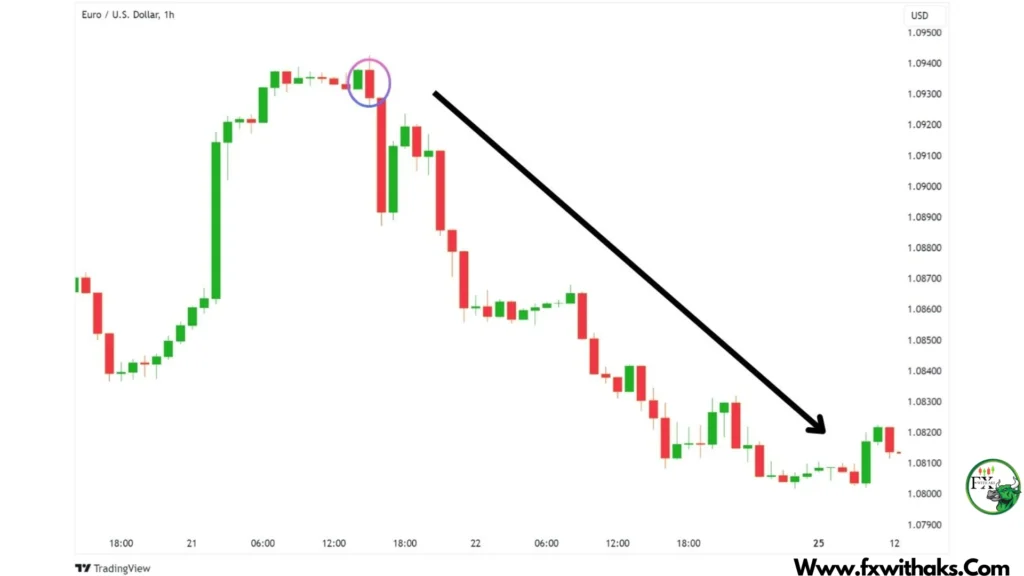
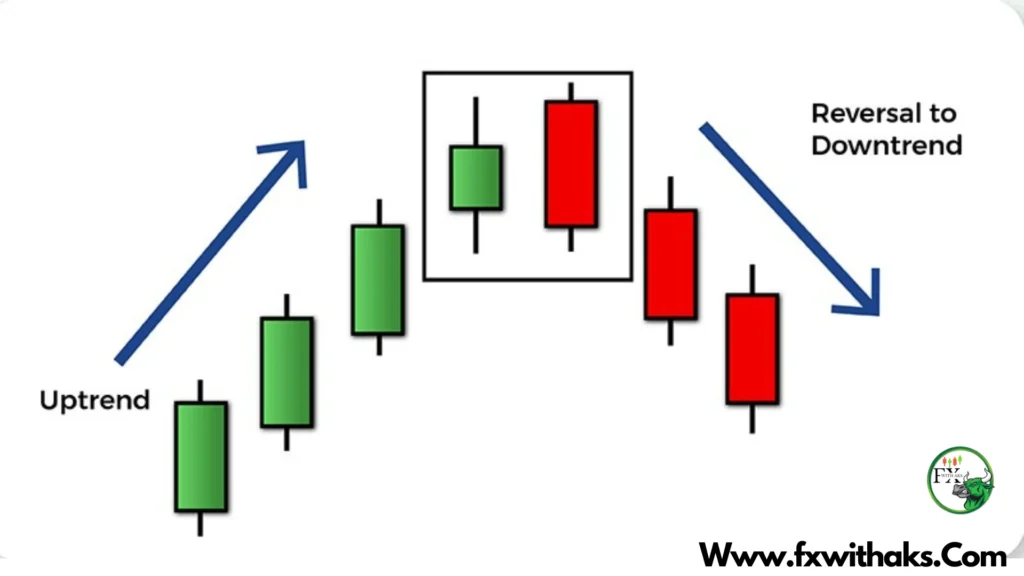
The Bearish Engulfing Candle is a classic and powerful bearish reversal candlestick pattern. It’s one of the most reliable signs that a current uptrend may be ending, and a downtrend could begin.

🔻 What is a Bearish Engulfing Candle?
📌 Characteristics:
- It’s a 2-candle pattern that appears after an uptrend.
- First candle: Small bullish (green) candle.
- Second candle: Large bearish (red) candle that completely engulfs the body of the first.
- The second candle opens above or near the first candle’s close and closes below its open.
🔍 Visual:
Day 1:   ▐██▌       (Small green candle)
Day 2: ███████▌    (Big red candle that engulfs the first)
🧠 What It Means:
- Bulls were in control (uptrend).
- Then sellers took over with force, wiping out the prior session’s gains.
- Strong signal of bearish momentum and a potential reversal.
✅ How to Trade the Bearish Engulfing Candle
Step 1: Identify the Pattern
- Look for a clear uptrend leading into the pattern.
- Spot a small bullish candle followed by a larger bearish candle that engulfs it.

Step 2: Wait for Confirmation (Optional but Safer)
- Wait for the next candle to also close red or break the low of the engulfing candle.
- This reduces the chance of a false signal.
Step 3: Enter the Trade
- Aggressive entry: Enter at the close of the engulfing candle.
- Conservative entry: Wait for a break below the engulfing candle’s low.
Step 4: Set Stop-Loss
- Place your stop-loss above the high of the engulfing candle.
- This gives protection against fakeouts or retests.
Step 5: Set Take-Profit
- Use one of these:
- Previous support zone
- Moving averages (like 50 EMA)
- Fibonacci levels
- Risk/reward ratio (2:1 is common)
📊 Example Setup
| Element | Value |
|---|---|
| Trend | Uptrend |
| Entry | Break of engulfing candle low |
| Stop-Loss | Above engulfing candle high |
| Take-Profit | Support zone / 2:1 R:R |
| Timeframe | 1H, 4H, Daily (stronger on higher TF) |

🔑 Pro Tips:
- Stronger signal if:
- It forms at a resistance level.
- There’s high volume on the engulfing candle.
- Confirmed by indicators like RSI (overbought) or MACD bearish crossover.
- Don’t use it in choppy or sideways markets — it’s most effective after clear trends.
Would you like a visual chart of this pattern, or a side-by-side comparison with other bearish patterns like the Shooting Star or Evening Star?

