
The Piercing Line is a bullish candlestick pattern that typically appears at the end of a downtrend, signaling a potential reversal to the upside. It consists of two candles:

- First Candle (Bearish): A long red (black) candlestick that closes near its low.
- Second Candle (Bullish): A long green (white) candlestick that opens below the previous candle’s low but closes above the midpoint of the first candle’s body.
Key Characteristics:
- Occurs after a downtrend.
- The second candle gaps down at the open but then closes above the midpoint of the previous red candle.
- Shows strong buying pressure as bulls regain control.
Interpretation:
- The gap down initially suggests that the bearish momentum is continuing.
- However, the strong upward movement of the second candle signals a shift in sentiment.
- If the next candlestick confirms the reversal (by closing higher), it strengthens the bullish signal.
Trading Strategy:
- Entry: Consider entering a long position when the next candle confirms the reversal with a higher close.
- Stop-Loss: Below the low of the second candle to manage risk.
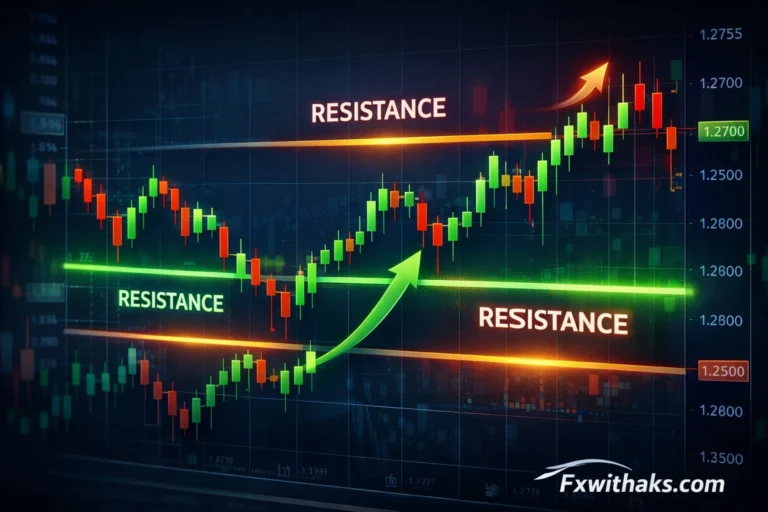
- Target: Look for resistance levels or use a risk-reward ratio of 2:1.
Structure of the Piercing Line Pattern
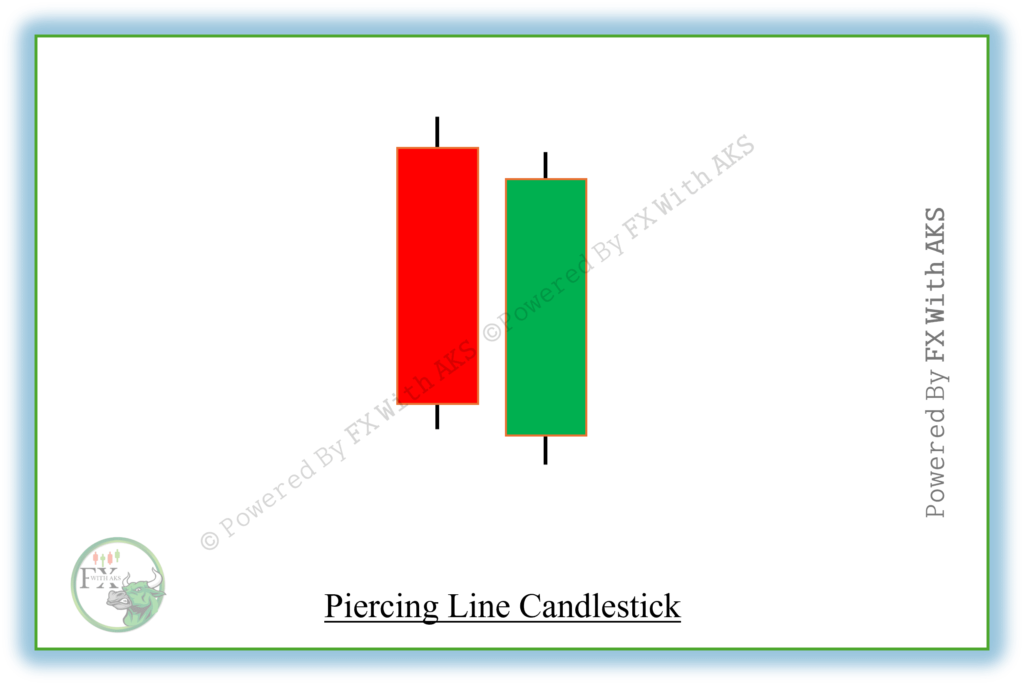
- First Candle (Bearish):
- A long red (or black) candle.
- Indicates strong selling pressure.
- Second Candle (Bullish):
- Opens below the low of the previous red candle (gap down).
- Closes above the midpoint of the first candle’s body.
- The deeper the second candle closes into the first, the stronger the signal.
Psychological Interpretation
- The bears are in control during the first day.
- On the second day, the market opens lower (suggesting continued bearish sentiment) but buyers step in, pushing the price higher.
- A close above the midpoint of the first candle signals that bulls are gaining momentum.
Key Confirmation Factors
- Appears after a clear downtrend.
- High trading volume on the second (bullish) candle.
- Ideally confirmed by a third bullish candle closing higher.
Comparison with Similar Patterns
- Bullish Engulfing: The second candle completely engulfs the first.
- Piercing Line: The second candle only pierces more than halfway into the first.
Example Illustration
sqlCopyEdit Day 1: ▼ Red Candle
Open: 100
Close: 90
Day 2: ▲ Green Candle
Open: 85 (gap down)
Close: 95 (closes above 90's midpoint of 95)
🏦 SIP আসলে কী? (সহজ ভাষায়) খুব সহজভাবে বললে, SIP হলো একটি জমানোর পদ্ধতি। যেমন আমরা……

Pivot Point Calculator Our Pivot Point Calculator is a powerful trading tool designed to help…
Support and resistance are among the most important concepts in technical analysis. Almost every…
Candlestick patterns are one of the most important tools used in trading. They help traders…
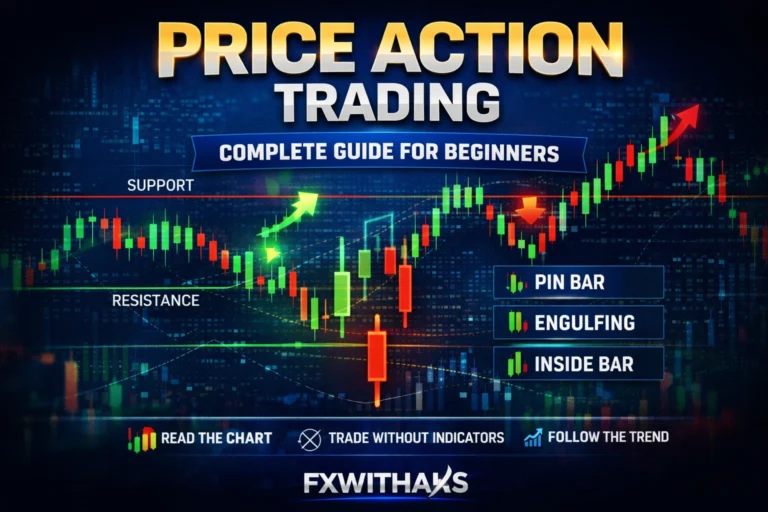
Price Action Trading is one of the most popular trading methods used by professional traders…

Learn Forex Trading from Scratch | FXWITHAKS Forex trading is one of the largest financial…

Forex Regulatory Organizations – Top Global Forex Regulators Below is a fully SEO-optimized blog…
A Gain & Loss Percentage Calculator helps you find the percentage increase (gain) or decrease…
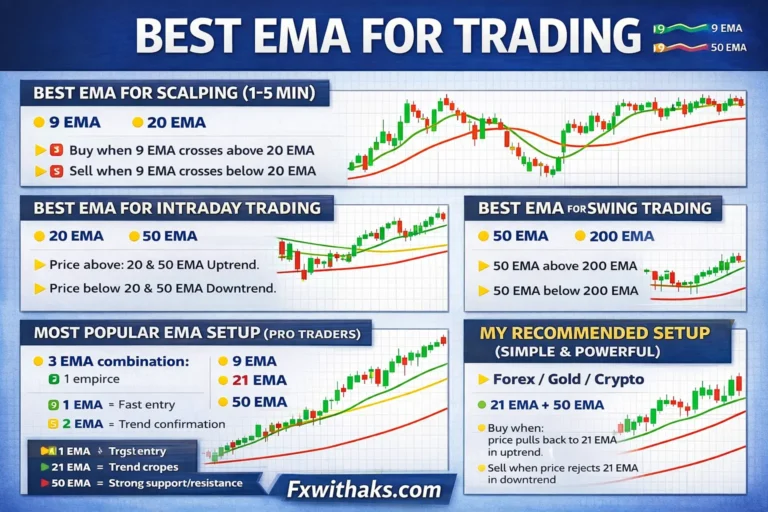
EMA (Exponential Moving Average) reacts faster to price than a normal moving average, which makes…