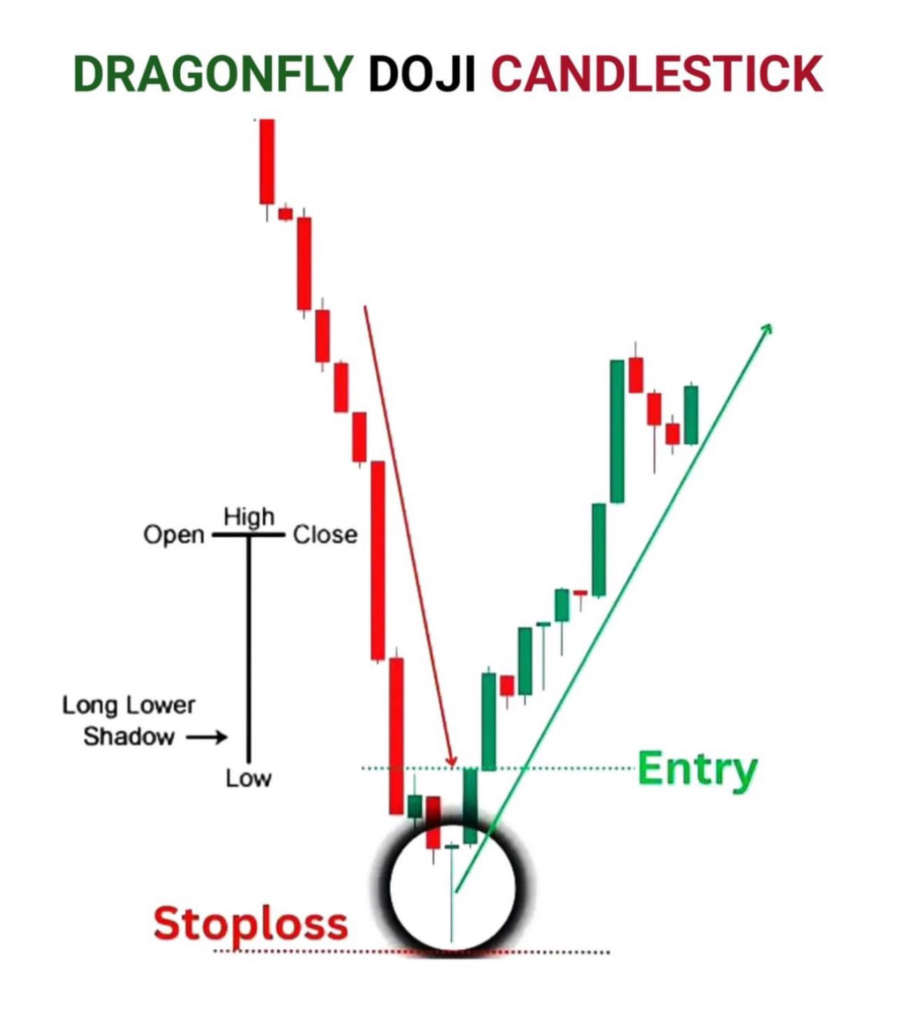
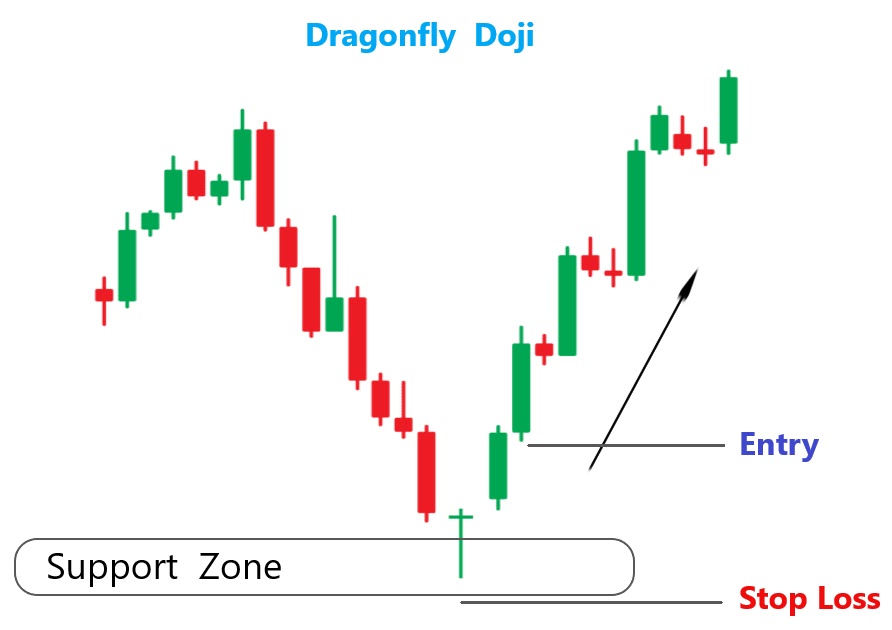
The Dragonfly Doji is a type of candlestick pattern used in technical analysis, often considered a potential reversal signal, especially after a downtrend.

📌 What it Looks Like:
- Open, High, and Close prices are all very close to each other (or even the same).
- There is a long lower shadow (wick) and little to no upper shadow.
Example:
   |
   |
   |
   o
(Where the “o” represents open/close/high and the long vertical line is the lower shadow.)
🔍 What it Means:
- The price dropped significantly during the session, but buyers regained control and pushed the price back up to the opening level.
- Suggests bullish potential, especially after a downtrend — could signal a reversal or strong support level.
✅ When It’s Stronger:
- Appears after a downtrend.
- Confirmed by a bullish candle that follows it (e.g., a strong green candle).
- Volume is above average, indicating conviction.
⚠️ Things to Watch Out For:
- It’s a potential signal, not a guarantee — always wait for confirmation.
- In sideways or choppy markets, it may be less meaningful.
Would you like an example chart or want to know how to trade using this pattern?
Great question! Trading with the Dragonfly Doji involves spotting the pattern and then confirming it before jumping into a trade. Here’s a simple, practical guide to help you trade it effectively:

🐉 How to Trade with a Dragonfly Doji
1. Identify the Dragonfly Doji
- Look for a candle with a long lower wick, little to no upper wick, and open/close at or near the high.
- Ideally, it forms after a downtrend, which increases its strength as a bullish reversal signal.
2. Wait for Confirmation
- Don’t enter a trade based on the Dragonfly Doji alone.
- Wait for the next candle to be bullish (a strong green candle that closes above the Dragonfly Doji’s high).
- This is your confirmation that buyers are taking control.
3. Enter the Trade
- Enter a long (buy) position after the confirming bullish candle closes.
- Some traders enter as soon as price breaks above the high of the Dragonfly Doji.
4. Set Stop-Loss
- Place your stop-loss just below the low of the Dragonfly Doji.
- This protects you in case the reversal fails and price continues downward.
5. Set Take-Profit (Target)
- Use resistance levels, previous swing highs, or a risk/reward ratio (e.g., 2:1 or 3:1).
- You can also use indicators like Fibonacci retracement or moving averages to guide exits.
📈 Example Setup (Bullish Reversal Trade):
- Downtrend → Dragonfly Doji forms → Next candle is bullish
- ✅ Entry: Above the Doji’s high
- ❌ Stop-Loss: Below the Doji’s low
- 🎯 Take-Profit: At next resistance or based on a 2:1 reward-to-risk ratio
🧠 Bonus Tips:
- Combine with volume: A Dragonfly Doji with high volume is stronger.
- Use with support zones: If it forms near a known support, it’s more reliable.
- Check other indicators (RSI, MACD, moving averages) to increase confidence.
Want a visual example or a simple trading strategy that includes this pattern?

