

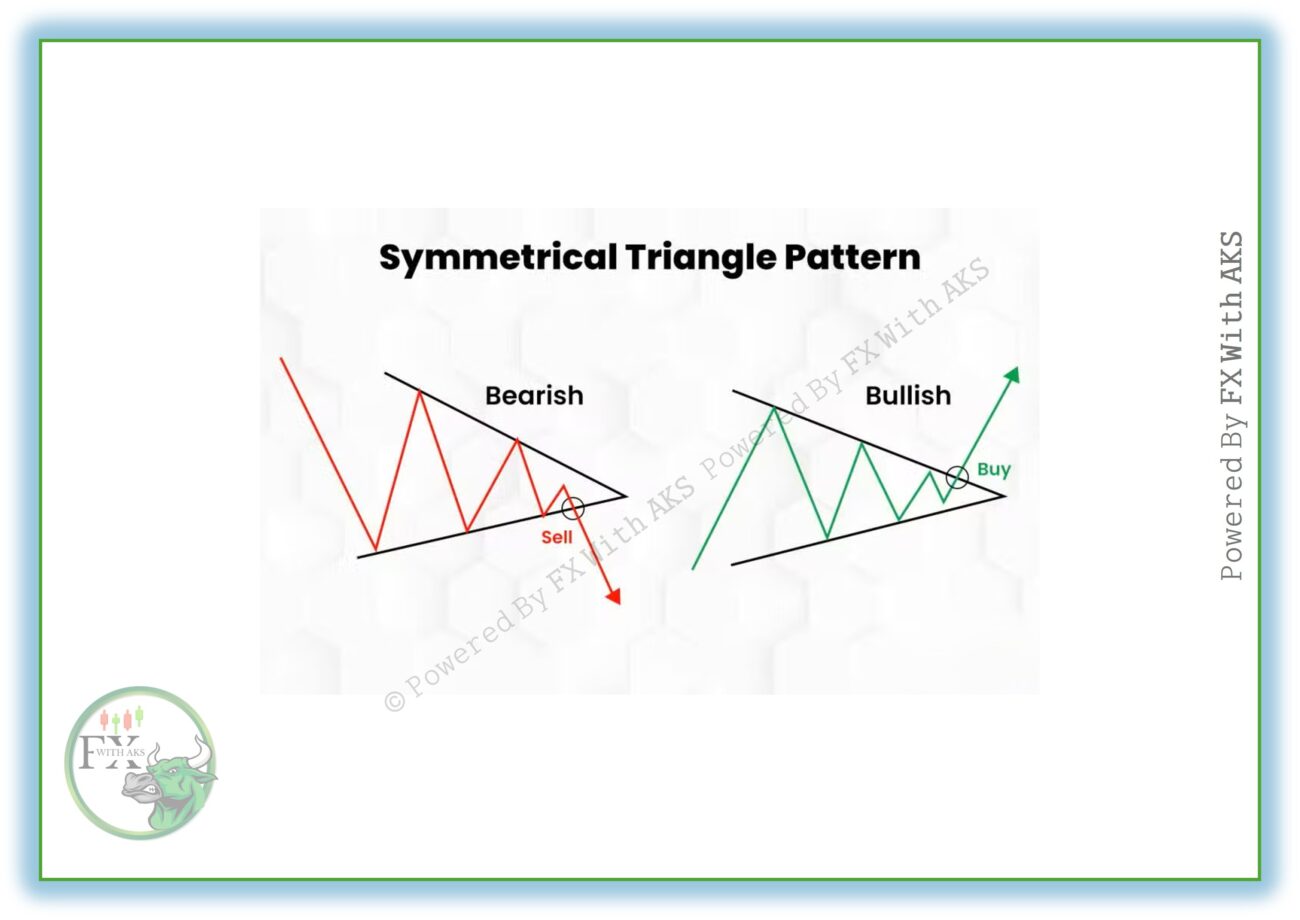
A Symmetrical Triangle is a chart pattern that appears when the market is consolidating, and it shows indecision between buyers and sellers. Over time, the highs get lower and the lows get higher, creating two converging trendlines that form a triangle.
Here’s a breakdown for you:
🔹 Characteristics:
- Formed by two trendlines:
- Upper trendline (descending resistance).
- Lower trendline (ascending support).
- Volume typically decreases as the pattern develops.
- Price moves inside the triangle until a breakout occurs.
🔹 Trading Psychology:
- Bulls push price higher, but each rally is weaker (lower highs).
- Bears push price lower, but each drop is weaker (higher lows).
- Market becomes “squeezed” → leading to a strong move when one side wins.
🔹 Breakout Direction:
- Can break upward (bullish continuation) or downward (bearish continuation).
- Breakouts often occur 2/3 to 3/4 of the way into the triangle.
- A valid breakout usually needs high volume for confirmation.
🔹 Trading Strategy:
- Identify the triangle (at least 2 touches on each trendline).
- Wait for breakout (don’t trade inside the triangle unless scalping).
- Confirm with volume or a retest of the broken trendline.
- Target = Height of the triangle (measured at widest part) projected from the breakout point.
- Stop-loss = Place just inside the opposite side of the triangle.
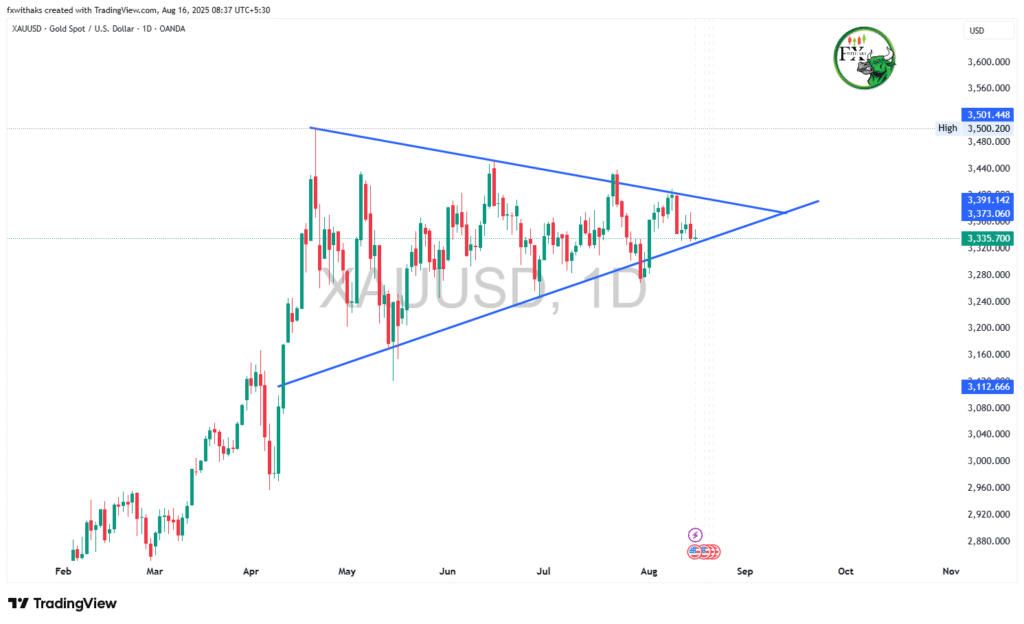
📊 Example:
If XAUUSD is consolidating in a symmetrical triangle, you’d wait for either a breakout above resistance for a buy, or a breakdown below support for a sell, with targets equal to the triangle’s height.
👉 Do you want me to draw a step-by-step chart example of a symmetrical triangle (bullish and bearish case) so you can visualize the breakout?
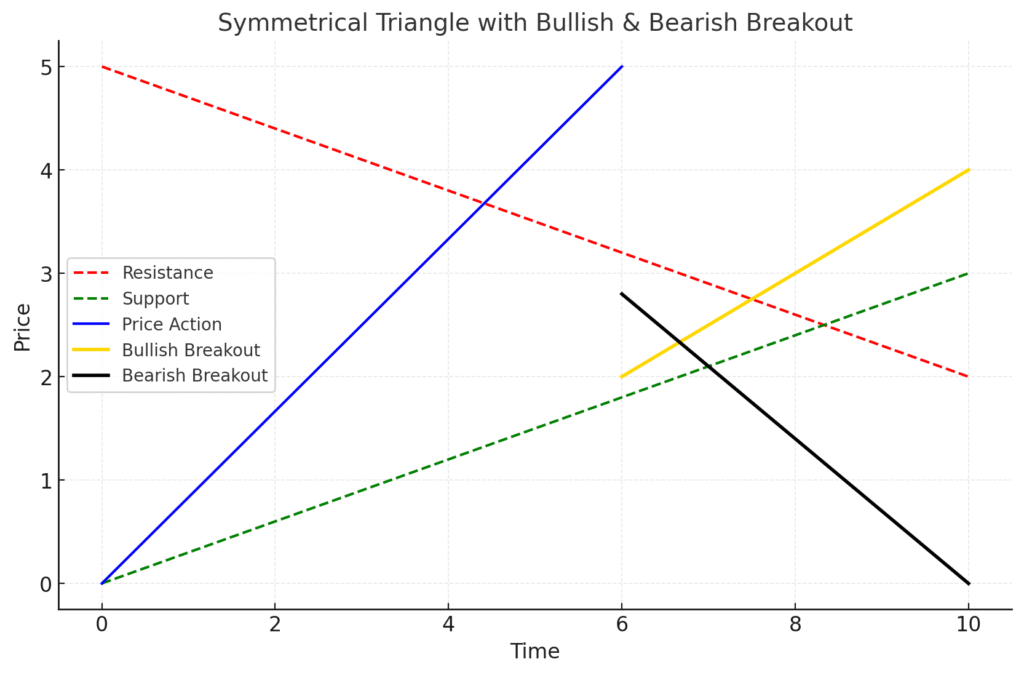
Here’s a visualization of the Symmetrical Triangle:
🔺 The red dashed line = descending resistance.
🔺 The green dashed line = ascending support.
🔵 Blue line = price consolidating inside the triangle.
✨ Gold line = bullish breakout.
⚫ Black line = bearish breakout.
This shows how price squeezes between support and resistance before breaking strongly in one direction.