

The Head and Shoulders pattern is a reversal pattern in technical analysis that signals a potential trend change. There are two main types:
- Head and Shoulders Top – bearish reversal (forms after an uptrend)
- Inverse Head and Shoulders – bullish reversal (forms after a downtrend)
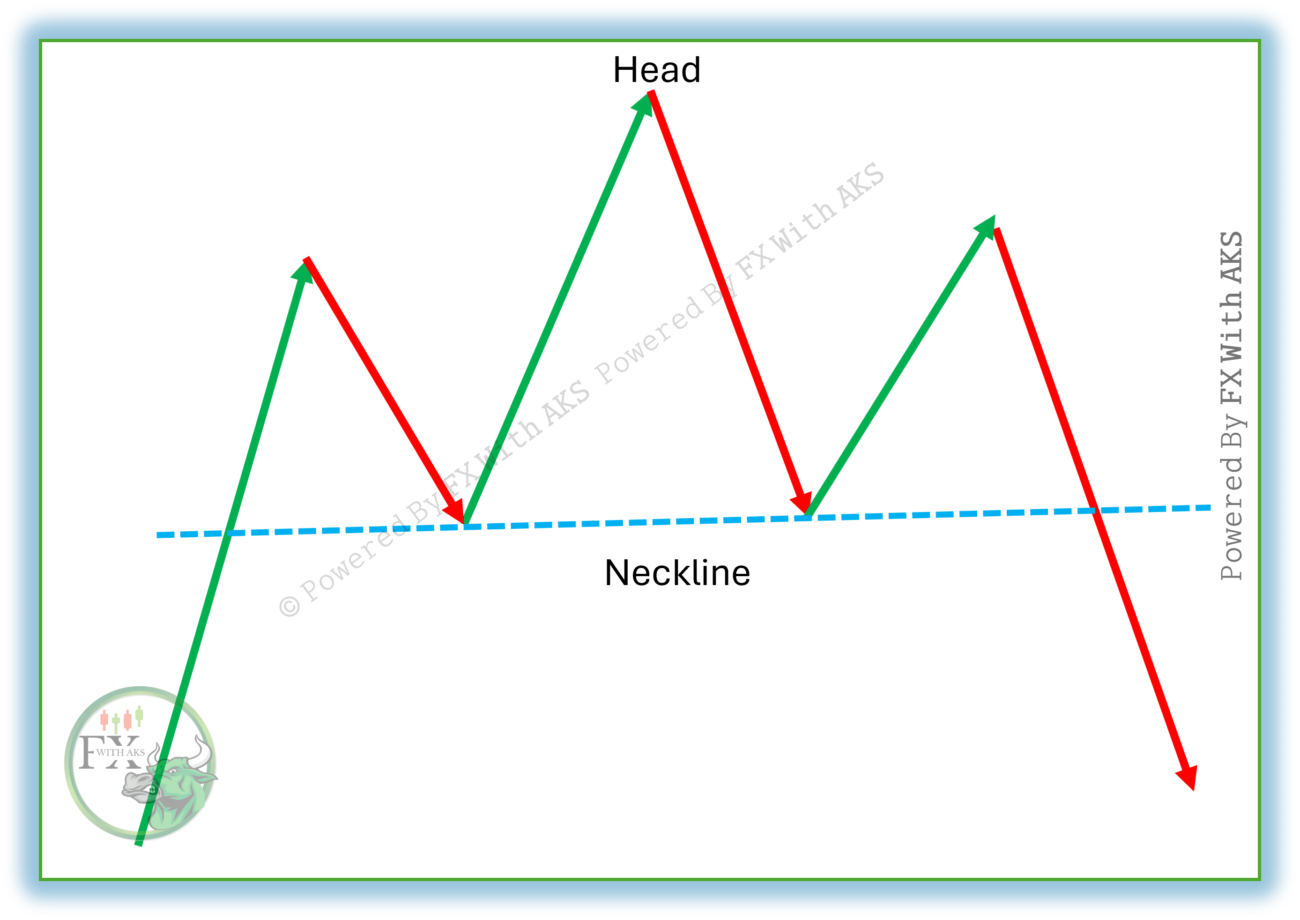
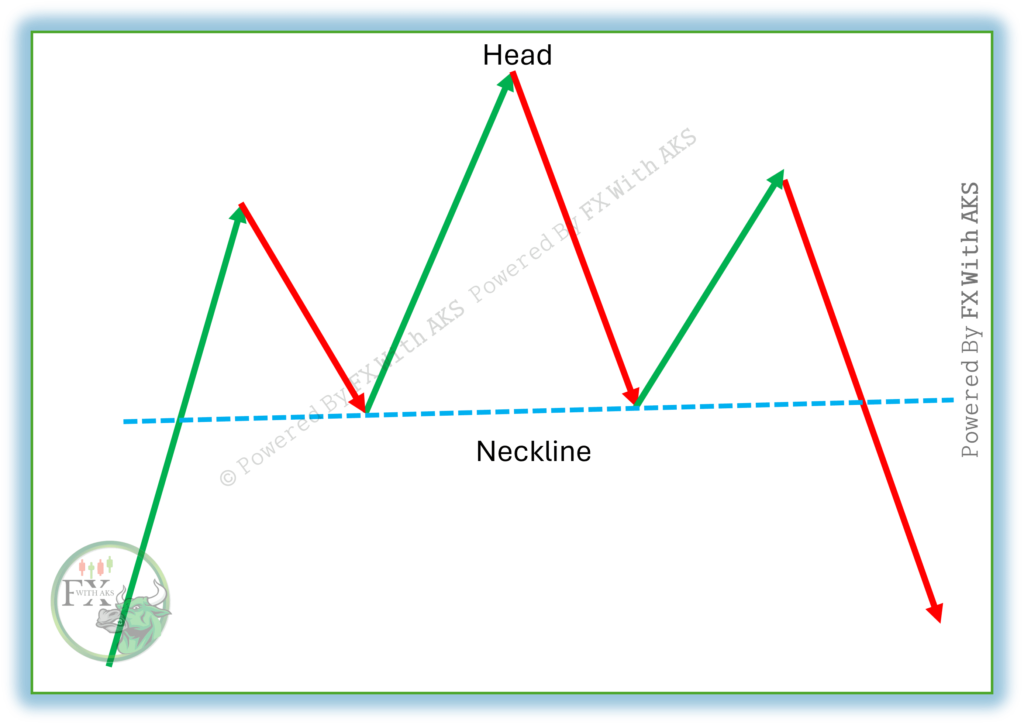
🧠 Head and Shoulders (Top) – Bearish Reversal
📈 Structure:
- Left Shoulder: Price rises, then falls.
- Head: Price rises again to a higher peak, then falls.
- Right Shoulder: Price rises again but to a lower peak than the head, then falls.
- Neckline: A support line connecting the two troughs (can be horizontal or sloped).
- Breakdown: When price breaks below the neckline = sell signal.
📉 Target Price:
Target = Neckline – (Head – Neckline)
🔄 Inverse Head and Shoulders – Bullish Reversal
📉 Structure:
- Left Shoulder: Price drops, then bounces.
- Head: Price drops further to a lower low, then bounces.
- Right Shoulder: Price drops again but not as low as the head.
- Neckline: Connects the highs between shoulders/head.
- Breakout: When price breaks above the neckline = buy signal.
📈 Target Price:
Target = Neckline + (Neckline – Head)
✅ Key Characteristics
| Feature | Description |
|---|---|
| Trend | Top: uptrend reversal; Inverse: downtrend reversal |
| Volume | Should decrease through pattern; rise at breakout |
| Neckline | Crucial level for confirmation |
| Confirmation | Only after price breaks neckline |
| Reliability | One of the most reliable reversal patterns |
⚠️ Things to Watch Out For
- Sloped necklines: Affect target projection and timing.
- Premature entries: Wait for breakout confirmation.
- Fakeouts: Use volume and other indicators for confirmation (e.g., RSI divergence).
Would you like a visual chart, or code to detect this in TradingView (Pine Script)?