
The Flag and Pole pattern is a continuation pattern in technical analysis that signals a brief consolidation before the prevailing trend resumes. It resembles a flag on a pole when visualized on a chart.
🏁 Flag and Pole Pattern Explained
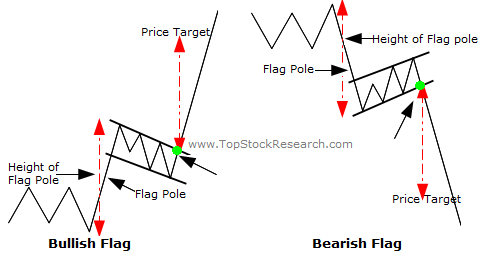
📏 Structure:
- Pole:
- A sharp, nearly vertical price movement (up or down) with strong volume.
- Indicates strong buying (in uptrend) or selling (in downtrend) pressure.
- Flag:
- A short-term consolidation zone that slopes against the trend (can be horizontal or slightly sloped).
- Formed by parallel trendlines (like a mini channel).
- Volume typically declines during this phase.
- Breakout:
- Price breaks out of the flag in the same direction as the pole.
- Volume should increase on the breakout.
📊 Types of Flag Patterns
| Pattern Type | Trend Before Flag | Flag Slope | Breakout Direction |
|---|---|---|---|
| Bull Flag | Strong uptrend | Slightly downward | Upward |
| Bear Flag | Strong downtrend | Slightly upward | Downward |
💡 Target Price Calculation
Target = Breakout point + (Height of the pole)
For Bear Flag:
Target = Breakout point - (Height of the pole)
✅ Example (Bull Flag)
- Price rises from $50 to $70 quickly → Pole = $20
- Then price consolidates between $66 and $68 forming a downward-sloping flag.
- Price breaks above $68 → Target = $68 + $20 = $88
🔍 Key Characteristics
| Feature | Description |
|---|---|
| Trend Direction | Continuation of prevailing trend |
| Volume | High during pole, low in flag, high at breakout |
| Timeframe | Pole: short & sharp; Flag: brief consolidation |
| Reliability | High, especially when supported by volume |
⚠️ Watch Out For
- Flags that take too long may lose momentum.
- Breakouts without volume can fail.
- Fakeouts: Use confirmation (e.g., RSI, MACD, breakout candle close).
Would you like a visual example, or a way to code/scan this in TradingView or other platforms?