

Falling Wedge
A falling wedge is a bullish chart pattern that signals a potential reversal or continuation of an uptrend.
It forms when price action consolidates between two downward-sloping trend lines that converge over time. Here’s how it works:
Key Characteristics
- Downward Sloping: Both resistance (upper) and support (lower) trendlines slope downward, with the upper line being steeper.
- Converging Lines: The price range narrows as it moves toward the apex of the wedge.
- Volume Decline: Trading volume generally decreases as the pattern develops.
- Breakout Direction: Typically, the price breaks out upward, signaling a bullish move.
Types of Falling Wedges
- Reversal Pattern: Appears after a downtrend and signals a potential trend reversal upward.
- Continuation Pattern: Occurs within an uptrend, indicating a temporary pullback before the price resumes rising.
How to Trade It
- Entry Point: Buy when price breaks above the resistance line with high volume.
- Stop-Loss: Place below the recent
Rising Wedge
A rising wedge is a bearish chart pattern that signals a potential reversal or continuation of a downtrend. It forms when price action consolidates between two upward-sloping trendlines that converge over time.

Key Characteristics
- Upward Sloping: Both resistance (upper) and support (lower) trendlines slope upward, with the lower trendline being steeper.
- Converging Lines: The price range narrows as it moves toward the apex of the wedge.
- Volume Decline: Trading volume generally decreases as the pattern develops.
- Breakout Direction: Typically, the price breaks out downward, signaling a bearish move.
Types of Rising Wedges
- Reversal Pattern: Appears after an uptrend and signals a potential trend reversal downward.
- Continuation Pattern: Occurs within a downtrend, indicating a temporary pullback before the price resumes falling.
How to Trade It
- Entry: Enter a short position when the price breaks below the lower trendline.
- Stop-Loss: Place a stop-loss just above the recent swing high.
- Target: Measure the height of the wedge at its widest point and project it downward from the breakout.
Would you like a comparison between the falling wedge and rising wedge for better clarity? 🚀
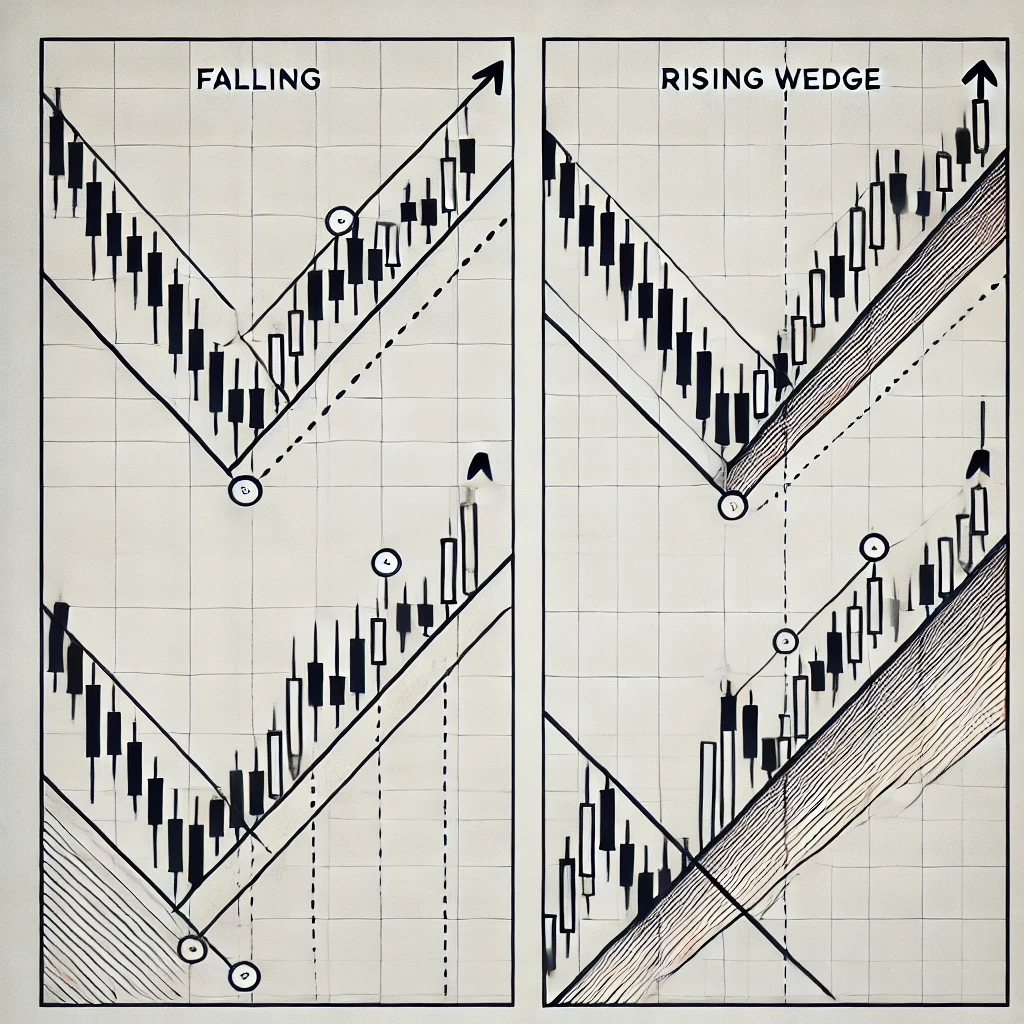
Difference Between Falling Wedge & Rising Wedge
Here’s an image illustrating the Falling Wedge (bullish) and Rising Wedge (bearish) patterns:
Falling Wedge (Bullish)
- Price consolidates within two downward-sloping, converging trendlines.
- Typically breaks out upward with increased volume.
Rising Wedge (Bearish)
- Price consolidates within two upward-sloping, converging trendlines.
- Typically breaks out downward with increased volume.
Generating the image now… 🎨📈

What Is a Wedge Pattern?
A wedge pattern forms when price moves within two converging trendlines, creating a narrowing structure.
This indicates decreasing momentum and often leads to a powerful breakout.
Key Characteristics of Wedge Patterns:
- Price consolidation with higher lows and lower highs
- Market indecision before a strong move
- Can act as reversal or continuation patterns
Falling Wedge Pattern (Bullish)
What Is a Falling Wedge?
A Falling Wedge occurs when price moves downward while forming:
- Lower highs
- Lower lows
- A tightening price range
Despite falling prices, selling momentum weakens over time, preparing the market for a bullish move.
Why Falling Wedge Is Bullish
- Sellers lose strength
- Buyers slowly step in
- Breakout usually happens upward
Best Market Conditions
- During a downtrend (reversal)
- During an uptrend (continuation)
- Near strong support zones
How to Trade the Falling Wedge Pattern
Entry Rules
- Identify a clear falling wedge structure
- Wait for a strong bullish breakout
- Enter Buy after candle closes above resistance
Stop Loss
- Below the most recent swing low
Target
- Measure the height of the wedge
- Or target the nearest resistance level
Rising Wedge Pattern (Bearish)
What Is a Rising Wedge?
A Rising Wedge forms when price moves upward while creating:
- Higher highs
- Higher lows
- A narrowing range
Although price is rising, buying momentum weakens, often leading to a bearish breakdown.
Why Rising Wedge Is Bearish
- Buyers lose momentum
- Sellers begin to dominate
- Breakdown typically occurs downward
Best Market Conditions
- During an uptrend (reversal)
- During a downtrend (continuation)
- Near major resistance zones
How to Trade the Rising Wedge Pattern
Entry Rules
- Identify a well-defined rising wedge
- Wait for a confirmed bearish breakdown
- Enter Sell after candle closes below support
Stop Loss
- Above the most recent swing high
Target
- Pattern height projection
- Or next support zone
Falling Wedge vs Rising Wedge (Comparison Table)
| Feature | Falling Wedge | Rising Wedge |
|---|---|---|
| Direction | Downward | Upward |
| Bias | Bullish | Bearish |
| Breakout | Up | Down |
| Momentum | Weak selling | Weak buying |
| Best Use | Buy setups | Sell setups |
Common Mistakes Traders Make
❌ Trading before breakout confirmation
❌ Ignoring volume
❌ Placing tight stop losses
❌ Trading against higher timeframe trend
Pro Tips for High Accuracy
✔ Always wait for candle close confirmation
✔ Combine with volume, RSI, moving averages
✔ Use higher timeframes (H1, H4, Daily)
✔ Apply proper risk management (1:2 RR or better)
Best Markets for Wedge Patterns
- Forex: EURUSD, GBPUSD, USDJPY
- Crypto: BTCUSD, ETHUSD
- Commodities: Gold (XAUUSD)
- Indices & Stocks
Final Thoughts
The Falling Wedge and Rising Wedge patterns are powerful tools when traded with patience and confirmation. They offer clear entries, defined risk, and strong reward potential.
Remember:
Patterns work best when combined with trend, volume, and disciplined risk management.