
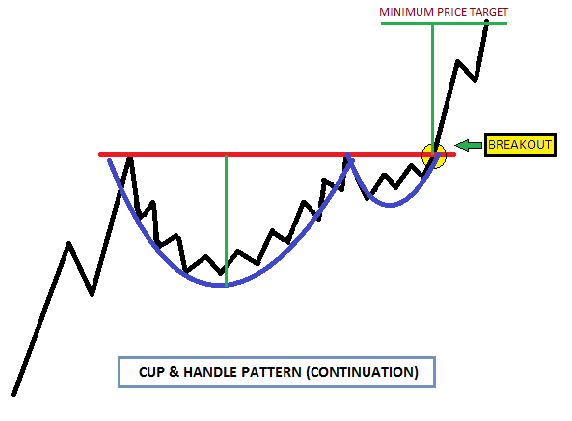
The Cup and Handle pattern is a bullish continuation pattern in technical analysis, typically signaling a potential upward breakout after a period of consolidation. It resembles the shape of a teacup on a price chart.
📈 Structure of the Pattern
- Cup:
- Rounded bottom: The price gradually declines, forms a rounded bottom, then rises back to approximately the previous high.
- Timeframe: Can form over several weeks to months.
- Shows a period of consolidation and accumulation.
- Handle:
- Shorter pullback: After reaching the previous high, the price pulls back slightly, forming a downward-sloping or horizontal channel (the “handle”).
- Lower volume often observed during the handle.
- Timeframe: Typically shorter than the cup, often a few days to weeks.
- Breakout:
- When price breaks above the resistance level formed by the cup’s rim, it’s considered a bullish signal.
- Volume should increase on breakout for confirmation.
📊 Key Characteristics
| Feature | Description |
|---|---|
| Trend Direction | Usually follows an uptrend |
| Cup Shape | U-shaped; V-shape is less reliable |
| Handle Decline | Ideally 10–15% from the rim |
| Breakout Signal | Above the handle’s resistance |
| Target Price | Height of cup added to breakout point |
✅ Example Use Case
- Stock XYZ is in an uptrend.
- It drops from $100 to $80, rounds out, and returns to $100.
- It pulls back to $95 (forming the handle).
- Breaks out above $100 on high volume.
- Target: $100 + ($100 – $80) = $120.
⚠️ Tips and Considerations
- Volume is critical: Low during the cup, lower during the handle, high during breakout.
- The pattern can fail—always manage risk with stop-losses.
- Best used in conjunction with other indicators (e.g., RSI, MACD).
Would you like an example chart or how to scan for this pattern using trading software?