

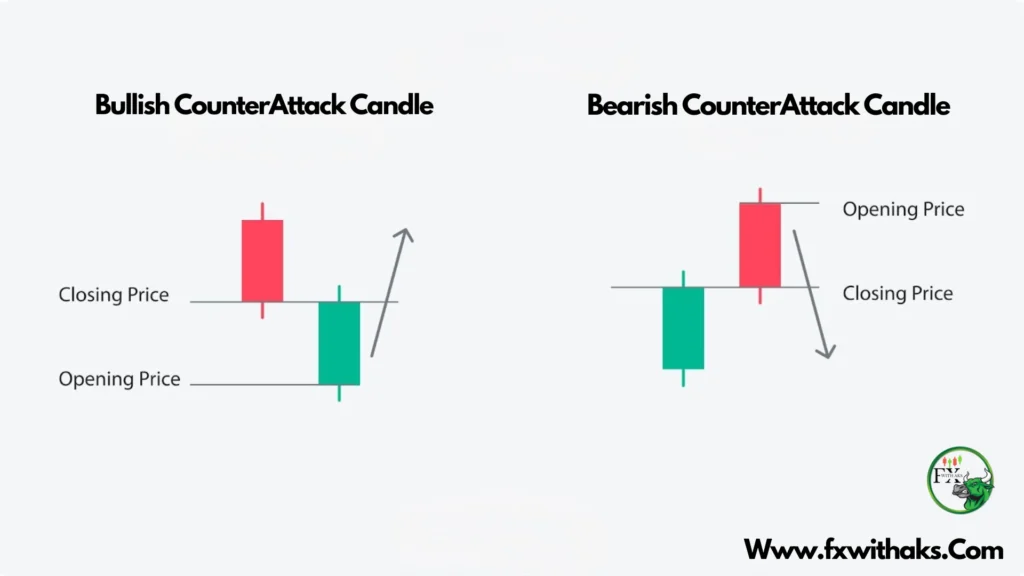
The Bearish Counterattack Pattern is a two-candle bearish reversal pattern seen on candlestick charts, typically at the top of an uptrend. It signals that bullish momentum may be weakening and bears might be taking control.
🧱 Pattern Structure
- First Candle:
- Strong bullish (green/white) candle
- Continues the current uptrend
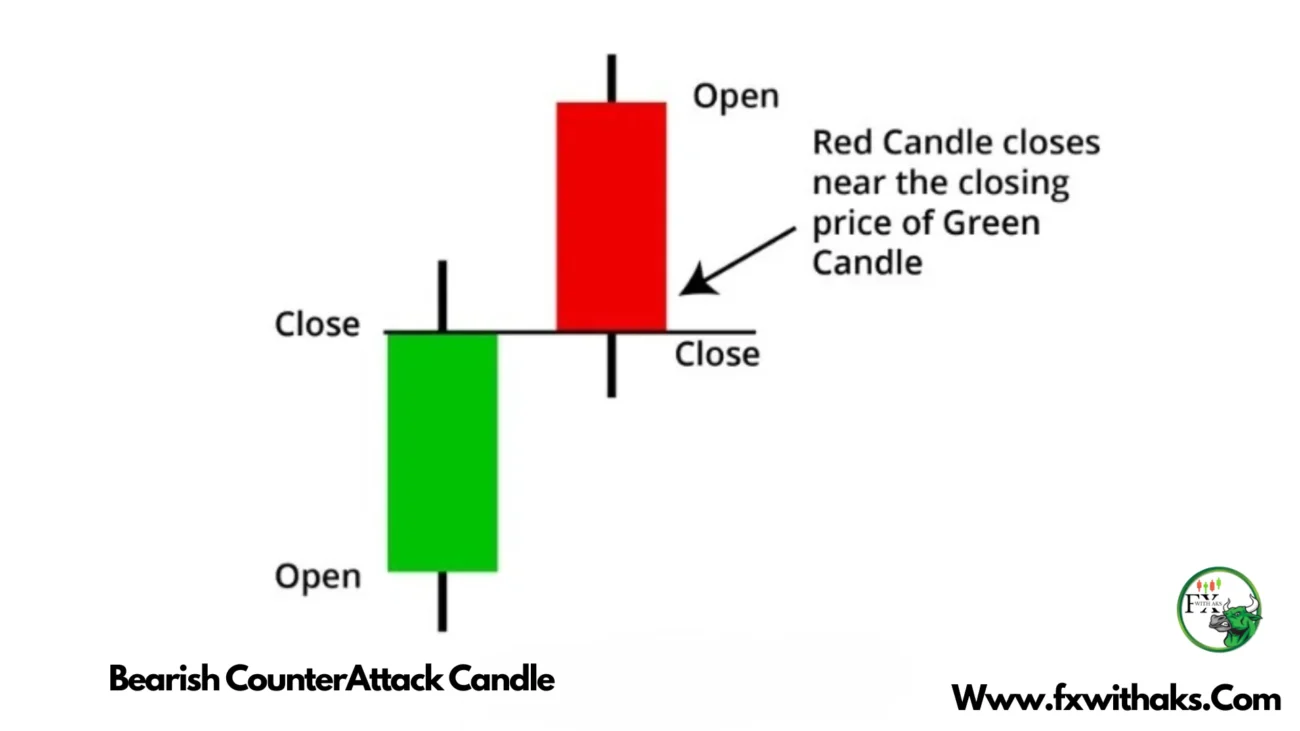
- Second Candle:
- Bearish (red/black) candle
- Opens with a gap up (price opens higher than the previous close)
- Closes at or near the previous candle’s close — creating a “counterattack” move
📉 What It Means
- Bulls initially push the price higher with a gap up
- Bears step in and completely reverse the day, pushing the price down to match the previous close
- The momentum shift suggests a potential reversal to the downside
✅ Confirmation Tips
- Appears after a clear uptrend
- Stronger if the pattern appears near resistance
- Even more valid with higher volume on the second candle
- Best used with indicators like RSI, MACD, or moving averages
Would you like a visual of this pattern or an example of how to trade it?
When Use Bearish Counter Attack Pattern
You should use the Bearish Counterattack Pattern when you’re looking for a potential bearish reversal at the top of an uptrend — especially if you’re planning to:
- Exit long positions (take profit before a downturn)
- Enter short positions (betting on price going down)
- Tighten stop-losses (protect gains if the trend reverses)
🕵️♂️ Ideal Conditions for Using It
- Clear Uptrend in Place
The pattern is only meaningful after a sustained upward move — don’t use it in a ranging or down-trending market. - Price Gaps Up Then Reverses
The bearish candle should open higher than the bullish candle’s close (gap up), then close near the previous candle’s close — this shows a clear rejection of higher prices. - Near Resistance or Overbought Area
- Watch for this pattern at key resistance levels
- Confirm with RSI > 70, MACD divergence, or volume spikes
✅ Good Practice: Confirm Before Acting
The Bearish Counterattack pattern alone isn’t enough to enter a trade. Look for confirmation like:
- A lower open or bearish follow-through candle the next day
- Bearish divergence on indicators
- Rejection at a Fibonacci level or major trendline
USE of Bearish Counter Attack Pattern
The use of the Bearish Counterattack Pattern lies in its ability to help traders spot potential bearish reversals, especially when a market has been trending upwards. Here’s how you can use it effectively:
🎯 1. Spot Trend Reversal Opportunities
- Use it at the top of an uptrend to anticipate a possible price drop.
- The pattern shows that bullish momentum is fading, and sellers are stepping in strongly.
💼 2. Trade Entry & Exit Signals
| Action | How |
|---|---|
| Exit Long Positions | If you’re in a buy trade, the pattern can warn you to lock in profits before a downturn. |
| Enter Short Positions | After confirmation, you can short the asset expecting a bearish move. |
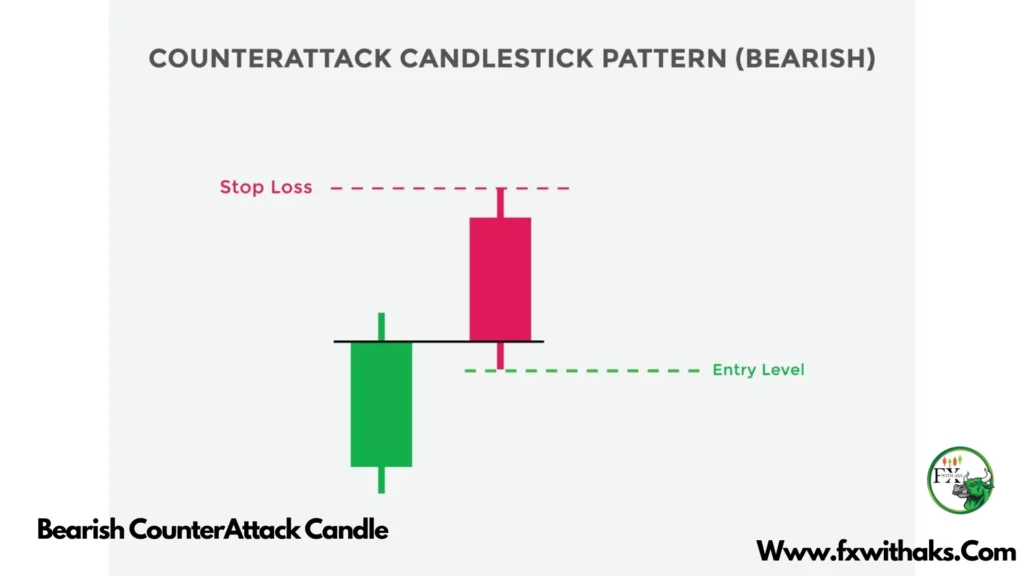
| Place Stop-Loss Orders | Helps define a stop-loss just above the high of the second candle. |
📊 3. Combine with Other Tools
To increase accuracy, use the pattern with:
- RSI (look for overbought conditions)
- MACD (bearish crossover)
- Volume (high volume on the second candle adds strength)
- Resistance levels or Fibonacci retracement zones
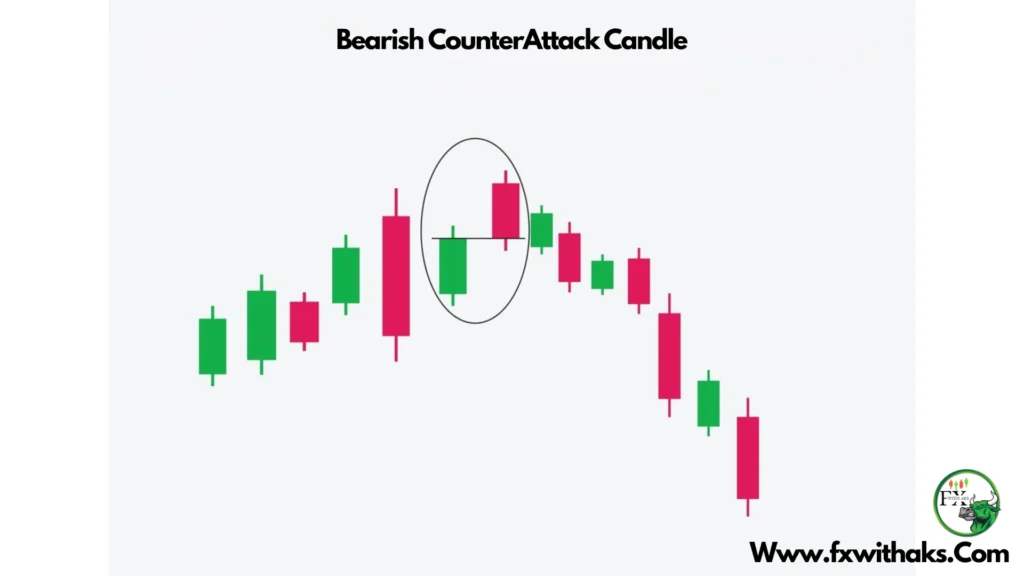
🔁 Trading Example
Imagine a stock has been rallying. One day:
- It opens higher (gap up) but closes at the same level as yesterday
- That forms a Bearish Counterattack
- The next candle opens lower → you enter a short position
- Stop-loss above the high, target previous support

Would you like a visual chart showing this in action or a sample strategy that uses it?