

Forex Pivot Point Calculator
Classic & Fibonacci Support and Resistance Levels
How This Pivot Point Calculator Works
This tool calculates the Pivot Point along with support and resistance levels using the High, Low, and Close prices.
Classic Pivot Method: Uses standard price averages and is widely used in intraday trading.
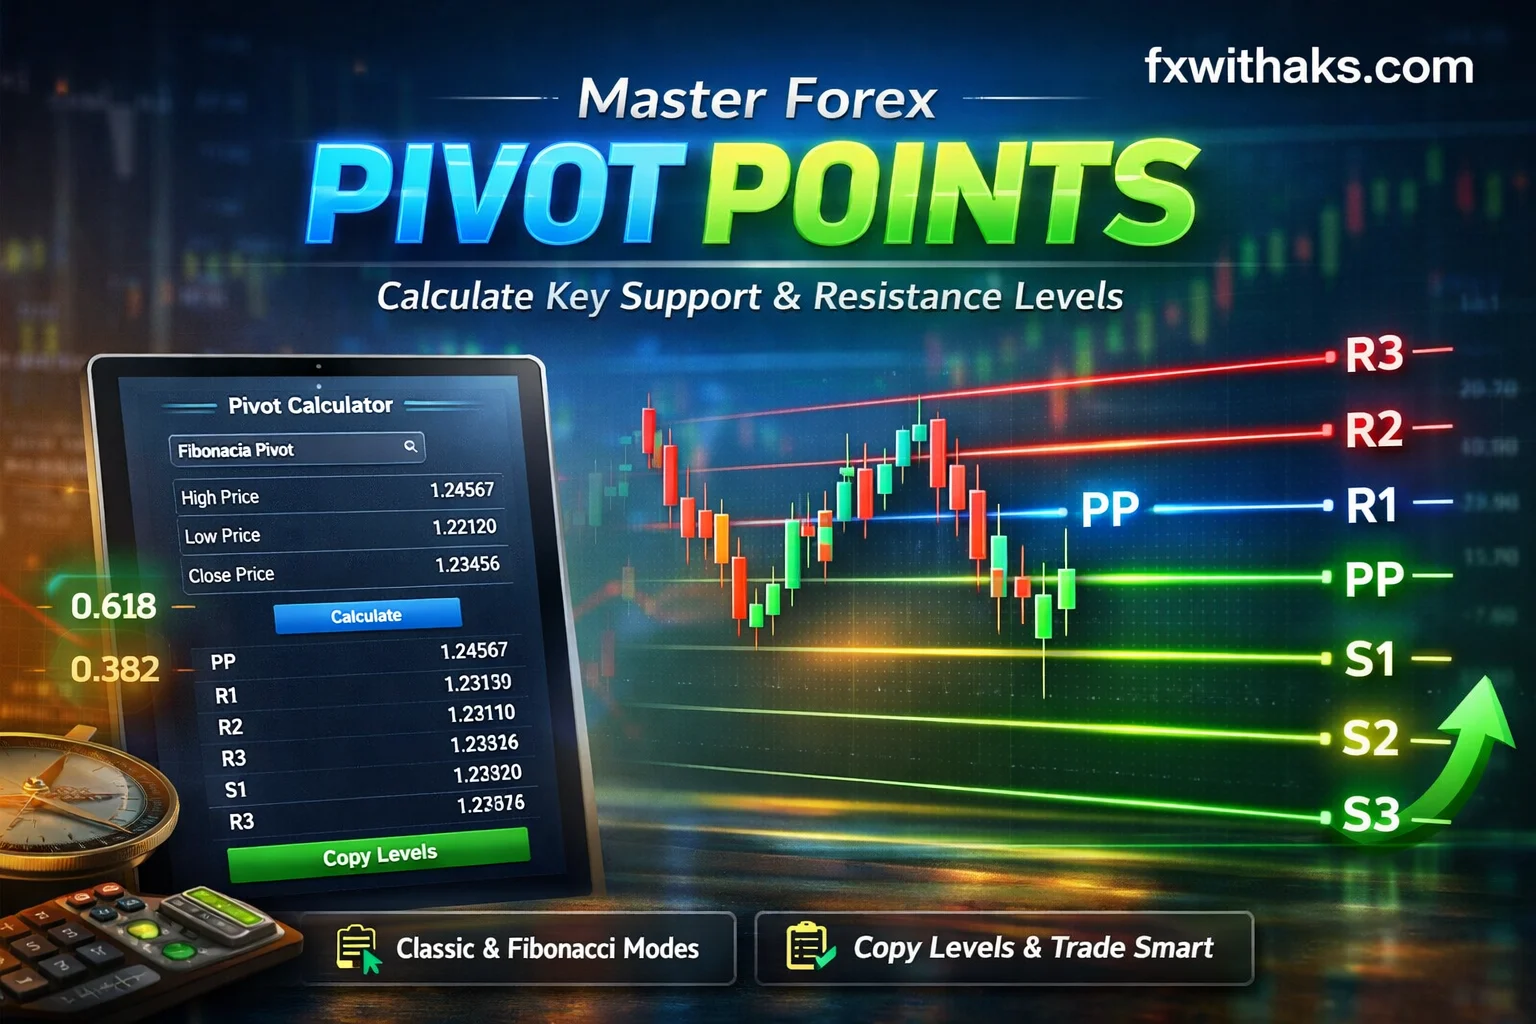
Fibonacci Pivot Method: Uses Fibonacci ratios to provide dynamic levels for trending markets.
How This Pivot Point Calculator Works
This Forex Pivot Point Calculator helps traders identify important support and resistance levels using the previous period’s price data.
To use this tool, simply enter the High Price, Low Price, and Close Price. The calculator will automatically compute the Pivot Point, along with multiple Resistance Levels and Support Levels.
Pivot Point:
The Pivot Point is the central level calculated from the average of the High, Low, and Close prices. It acts as a key reference point for determining market direction.
Resistance Levels:
Resistance Level 1, Resistance Level 2, and Resistance Level 3 indicate price levels where the market may face selling pressure and move downward.
Support Levels:
Support Level 1, Support Level 2, and Support Level 3 indicate price levels where the market may find buying interest and move upward.
Classic Pivot Method:
This method uses a standard formula based on price averages. It is widely used by traders for intraday analysis and works well in normal market conditions.
Fibonacci Pivot Method:
This method uses Fibonacci ratios such as 0.382, 0.618, and 1.0 to calculate support and resistance levels. It is especially useful in trending markets and helps identify retracement and breakout zones.
Traders use these levels to plan trade entries, set stop-loss orders, determine profit targets, and identify potential market reversals or breakouts.