
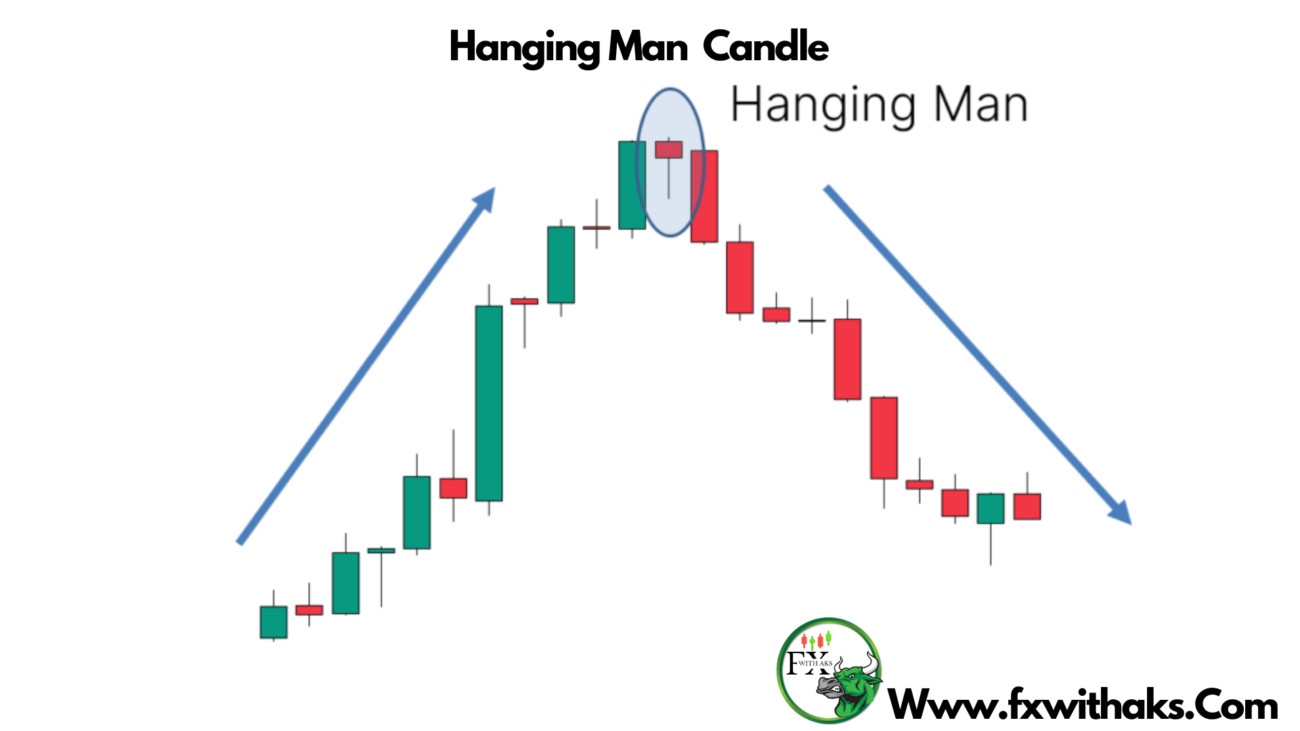
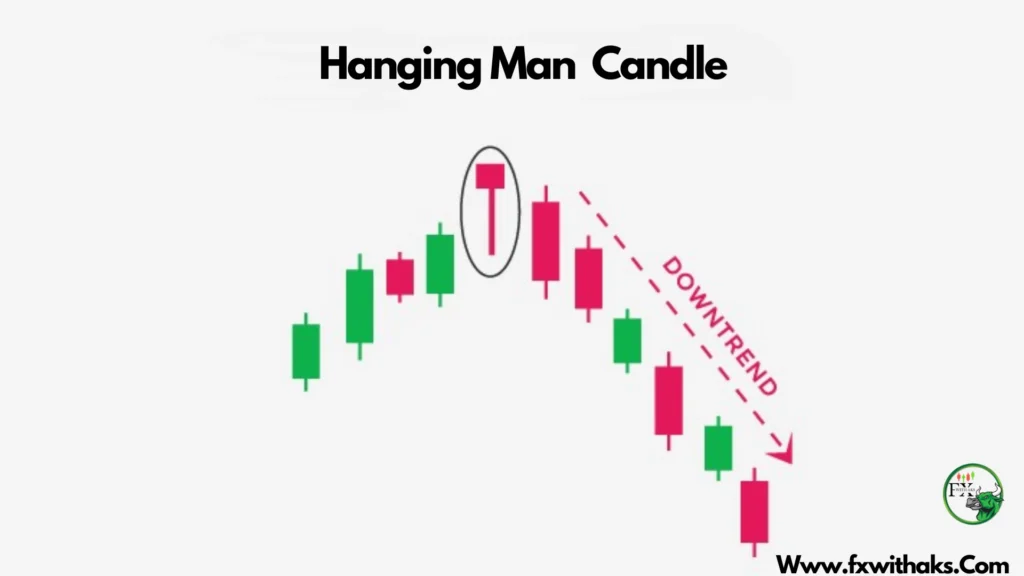
The Hanging Man candlestick is a bearish reversal pattern that appears after an uptrend, signaling that buying pressure may be weakening and a downtrend could be coming.
🪓 What is a Hanging Man Candle?
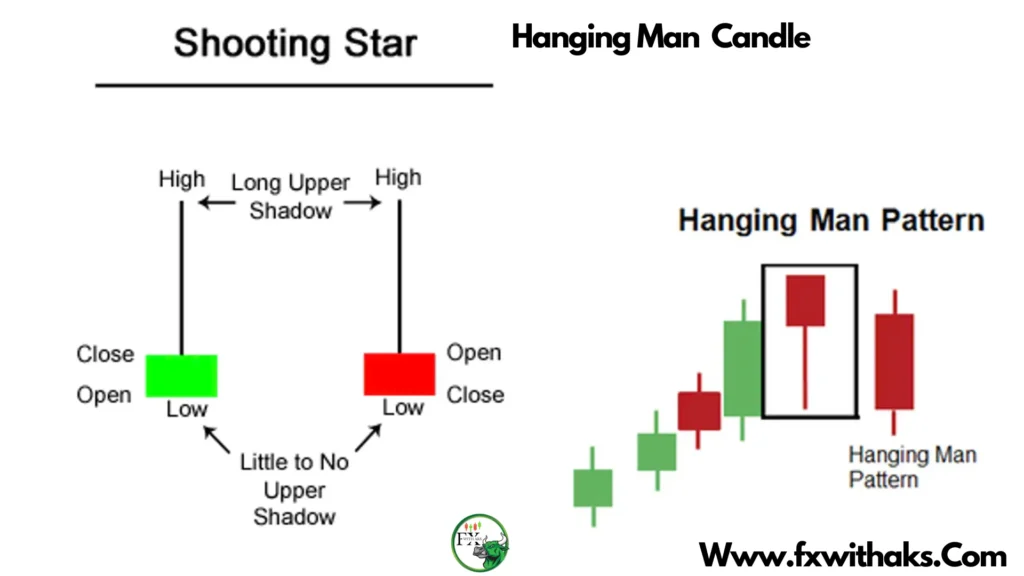
📌 Characteristics:
- Forms after a strong uptrend.
- Has a small real body near the top of the candle.
- Has a long lower shadow (at least 2x the body size).
- Little to no upper shadow.
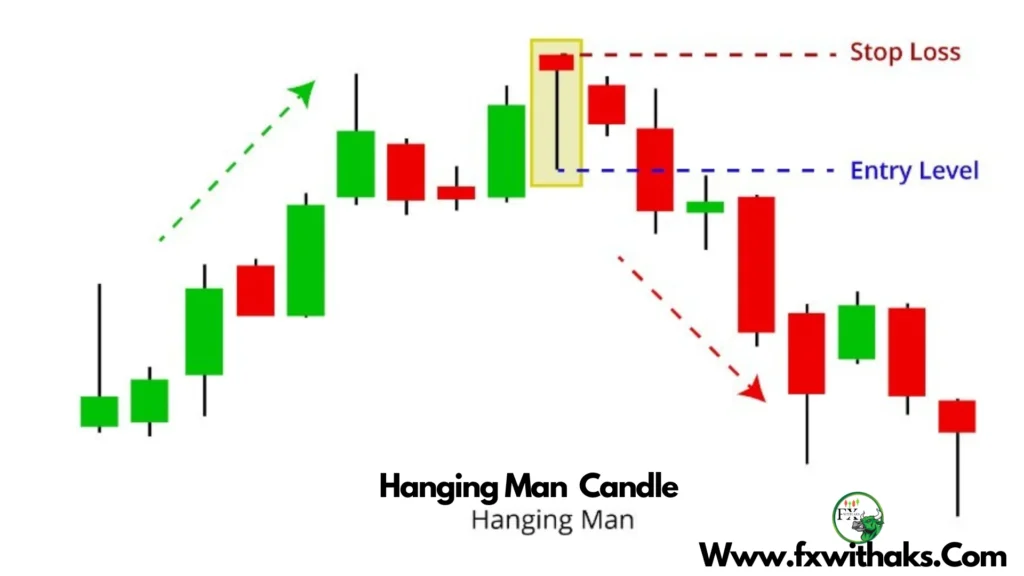
🔍 Visual:
   █
   |
   |
(The long lower wick shows selling pressure during the session.)
🧠 What It Tells You:
- Buyers pushed the price up during the uptrend.
- But during this session, sellers stepped in, pulling the price way down.
- Even though price closed near the top, the large lower shadow shows selling pressure is increasing.
➡️ It’s a warning: the bulls are losing control.
✅ How to Trade the Hanging Man Candle
1️⃣ Spot the Pattern
- Appears after an uptrend.
- Long lower wick, small body near the top.
2️⃣ Wait for Confirmation
- Don’t enter based on the Hanging Man alone.
- Wait for the next candle to be bearish and close below the Hanging Man’s body.
- This confirms sellers are taking over.
3️⃣ Enter the Trade
- Enter a short position:
- At the close of the confirmation candle, or
- On a break below the Hanging Man’s low.
4️⃣ Place Stop-Loss
- Set stop-loss above the Hanging Man’s high.
- Gives room to avoid fakeouts.
5️⃣ Take-Profit Target
- Use:
- Previous support levels.
- Fibonacci retracement (38.2%, 50%, etc.).
- A solid risk/reward ratio like 2:1.

📊 Example Setup
| Element | Value |
|---|---|
| Trend | Uptrend |
| Pattern | Hanging Man |
| Entry | After confirmation candle |
| Stop-Loss | Above Hanging Man’s high |
| Take-Profit | Support zone / 2:1 R:R ratio |
🔑 Pro Tips:
- Stronger when:
- Volume is high on the Hanging Man candle.
- It forms at a resistance zone.
- Confirmed by other indicators (like RSI > 70 or MACD turning bearish).
- Works best on 4H or Daily timeframes.
Want me to generate a visual example, or compare it with the Hammer candle (they look similar but have different meanings)?