The Three White Soldiers is a bullish reversal candlestick pattern that signals a potential trend change from a downtrend to an uptrend.
It consists of three consecutive bullish (green or white) candlesticks with the following characteristics:

Key Features of the Three White Soldiers Pattern
➡️Three consecutive bullish candles – Each candle closes higher than the previous one.
➡️Small or no wicks – The candles ideally have small or no upper and lower shadows, indicating strong buying pressure.
➡️Opens within the previous candle’s body – The second and third candles typically open within the body of the prior candle and then close near the highs.
➡️Progressive growth – The candles should be of similar size, showing steady bullish momentum.
➡️Appears after a downtrend – This pattern is significant only when it forms after a downtrend, signaling a reversal.
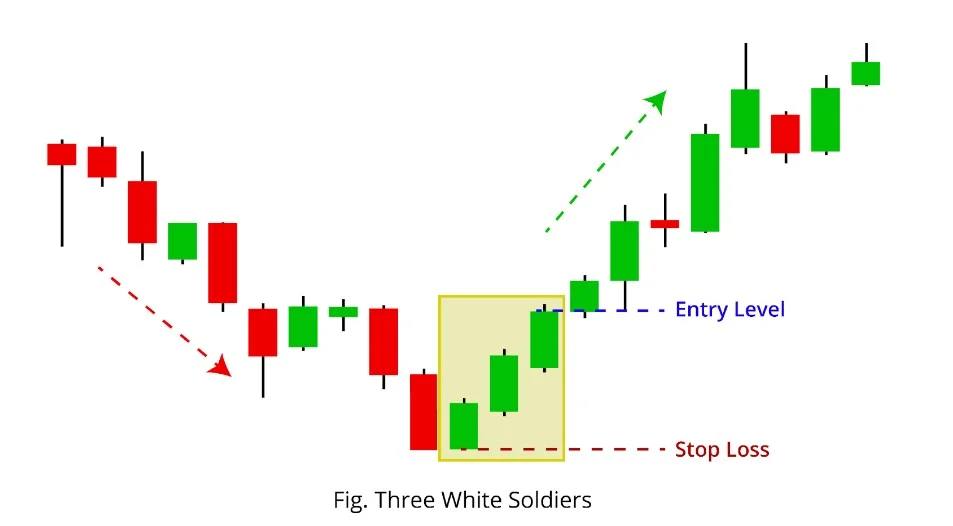
Three White Soldiers Candlestick Patterns
Market Psychology Behind the Pattern
- Day 1: The first bullish candle suggests that buyers are entering the market.
- Day 2: The second bullish candle reinforces the buying momentum, reducing confidence among sellers.
- Day 3: The third bullish candle confirms the strength of buyers, often leading to a continued uptrend.
How to Trade the Three White Soldiers Pattern
- Confirm the pattern – Ensure that it appears after a downtrend and follows the key characteristics.
- Check volume – Higher volume during formation strengthens the validity of the pattern.
- Wait for a pullback or confirmation – Sometimes, a small pullback or consolidation follows before a stronger uptrend.
- Use stop-loss orders – Place a stop-loss below the first candle of the pattern to manage risk.
- Combine with other indicators – RSI, moving averages, or MACD can provide additional confirmation.
Potential Risks
- If the candles are too large, it could indicate overextension, leading to a possible pullback.
- A sudden increase in price might be caused by short covering rather than genuine buying interest.
- Strong resistance levels nearby can limit upside potential.
Would you like a chart example or any specific trading strategy using this pattern?
More Post From FX WITH AKS…