

The Marubozu candlestick pattern is one of the strongest price action signals in technical analysis. It represents pure buying or selling pressure with almost no market hesitation, making it a favorite pattern among professional traders.
What Is a Marubozu Candlestick?
A Marubozu candle has:
- No upper or lower wicks (or very small ones)
- A long real body
- Clear dominance of either buyers or sellers
The word Marubozu comes from Japanese and means “bald” or “shaven”, indicating the absence of shadows.
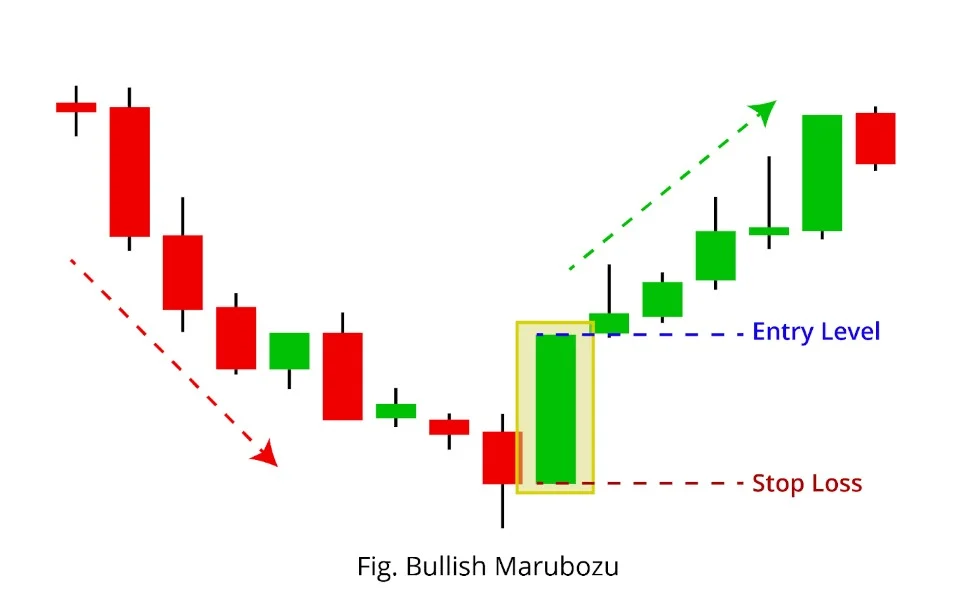
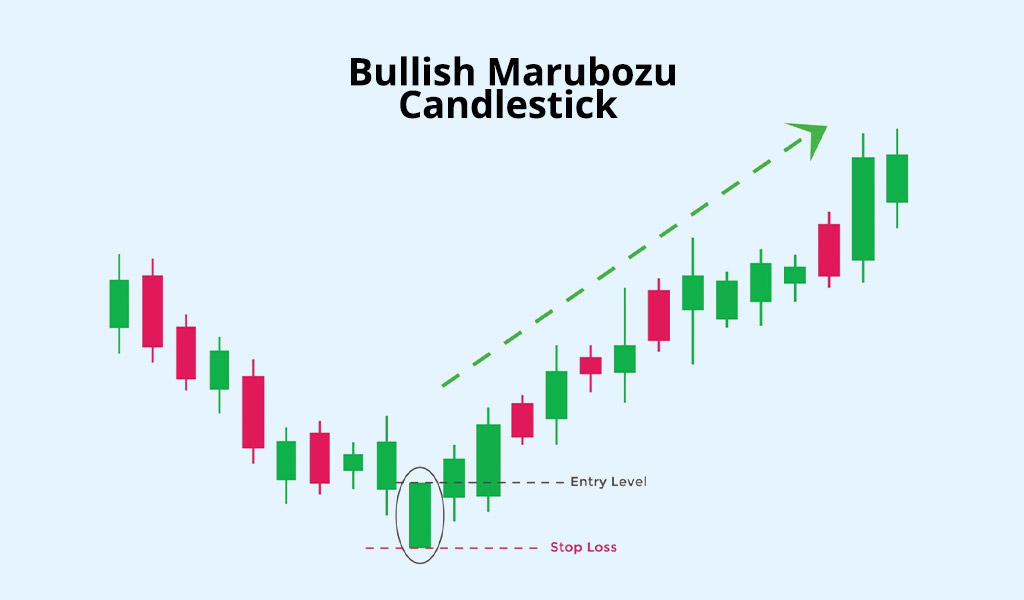
A Bullish Marubozu is a strong candlestick pattern in technical analysis that signals strong buying pressure.
Types of Marubozu Candlestick Pattern
1. Bullish Marubozu
- Opens at the low
- Closes at the high
- Indicates strong buying momentum
- Signals continuation or start of an uptrend
Best used in: Uptrends, breakouts, support zones
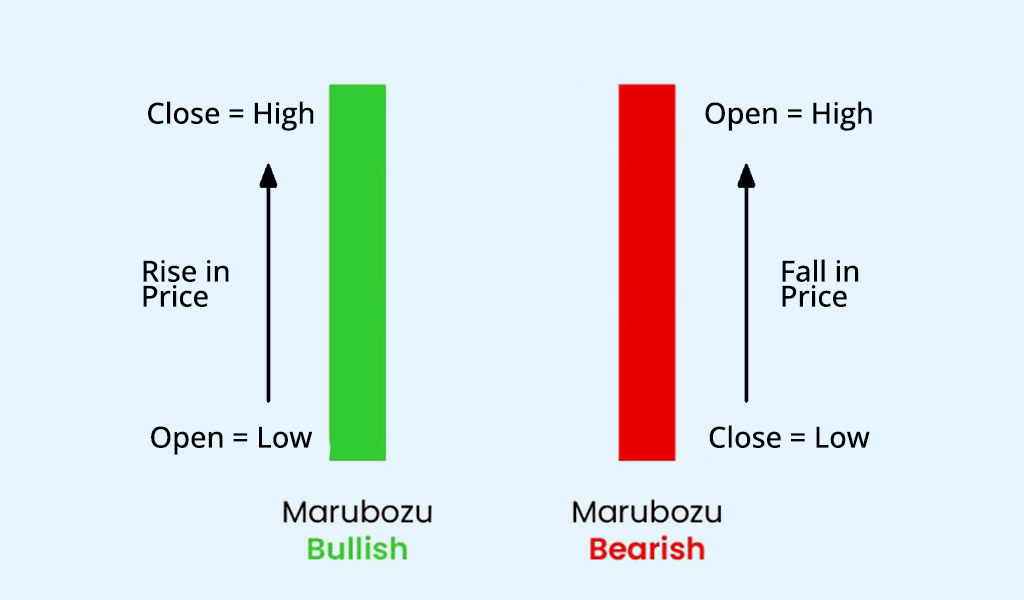
It is characterized by a long green (or white) body with no wicks (shadows) on either end, meaning:
- Open = Low
- Close = High
2. Bearish Marubozu
- Opens at the high
- Closes at the low
- Indicates strong selling pressure
- Signals continuation or start of a downtrend
Best used in: Downtrends, breakdowns, resistance zones
Why Marubozu Is Important in Trading
✔ Shows institutional strength
✔ Confirms trend continuation
✔ Useful for breakout and momentum trading
✔ Works well on Forex, Crypto, Stocks, Indices, Gold (XAUUSD)
How to Trade Using Marubozu Pattern
Bullish Marubozu Strategy
- Identify a bullish Marubozu near support or breakout level
- Enter Buy above the candle high
- Stop Loss below the candle low
- Target next resistance or use risk-reward 1:2 or higher
Bearish Marubozu Strategy
- Spot a bearish Marubozu near resistance or breakdown
- Enter Sell below the candle low
- Stop Loss above the candle high
- Target next support zone
Pro Tips for Better Accuracy
🔹 Always trade Marubozu with trend direction
🔹 Combine with volume, RSI, Moving Averages
🔹 Avoid trading during low-liquidity sessions
🔹 Higher timeframes (H1, H4, D1) give stronger signals
Would you like a visual example or help with identifying it on a chart? 🚀