


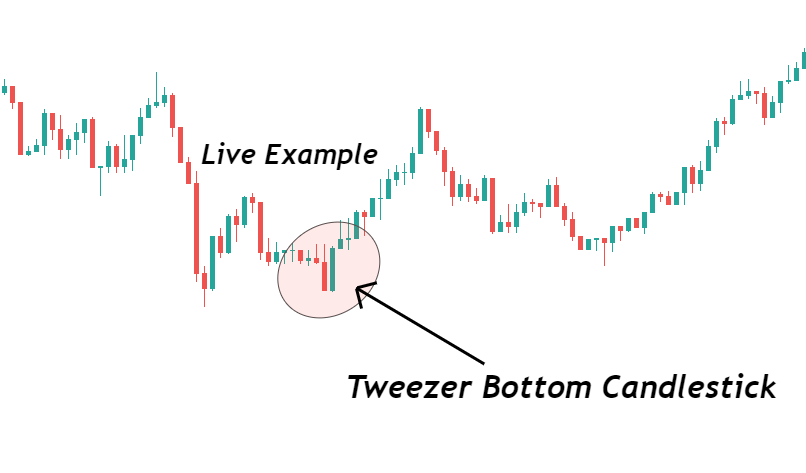
The “Tweezer Bottom” is a Candlestick Pattern used in technical analysis to indicate a potential bullish reversal in a downtrend.1 Here’s a breakdown of its key characteristics:
- Definition:
- It’s a bullish reversal pattern that appears at the end of a downtrend.
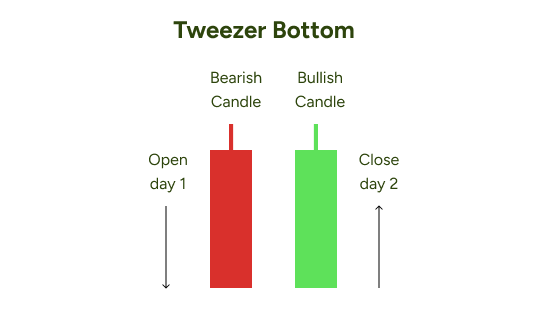
- It consists of two candlesticks with nearly identical lows.
- The first candlestick is bearish (downward movement), and the second is bullish (upward movement).
- The matching lows suggest that the selling pressure is subsiding, and buyers are stepping in.
- Key Characteristics:
- Downtrend: The pattern occurs after a period of price decline.
- Two Candlesticks: It involves two consecutive candlesticks.
- Matching Lows: The most crucial feature is that the lows of the two candles are very close or identical. This indicates a level of support.
- Bearish Followed by Bullish: The first candle is typically bearish, continuing the downtrend, while the second is bullish, signaling a potential reversal.
- Interpretation:
- The tweezer bottom pattern suggests that the downtrend may be losing momentum.
- The matching lows indicate that buyers are entering the market and preventing further price declines.
- Traders often view this pattern as a signal to consider entering long positions (buying).
- Important Considerations:
- Like any technical analysis tool, the tweezer bottom pattern is not foolproof.
- It’s often recommended to use other indicators and analysis techniques to confirm the signal.
- Trading volume can also provide additional confirmation.
- It is always wise to use stop loss orders when trading this or any other pattern.
In summary, the tweezer bottom is a visual pattern that can help traders identify potential buying opportunities in a downtrend.
Here’s a breakdown of how to approach it:

1. Identifying the Tweezer Bottom Pattern:
- Downtrend:
- Ensure the pattern appears after a clear downtrend. This is crucial for the pattern’s reliability.
- Two Candlesticks:
- Look for two consecutive candlesticks.
- Matching Lows:
- The key is that the two candlesticks have nearly identical lows. The wicks (shadows) of the candles are the most important part of this identification.
- Bearish-Bullish Sequence:
- The first candlestick should be bearish (closing lower than its open), and the second should be bullish (closing higher than its open).
2. Trading Strategies:
- Confirmation:
- Don’t rely solely on the pattern. Seek confirmation from other technical indicators. Common confirmations include:
- Increased Volume: Higher trading volume on the bullish candlestick strengthens the reversal signal.3
- Other Indicators: Indicators like the Relative Strength Index (RSI) or moving averages can provide additional confirmation.4
- Support Levels: If the pattern forms near a known support level, it adds to its significance.
- Don’t rely solely on the pattern. Seek confirmation from other technical indicators. Common confirmations include:
- Entry:
- A common entry point is to wait for a candlestick to close above the high of the tweezer bottom pattern. This helps confirm the bullish reversal.
- Some more agressive traders may enter on the close of the second bullish candle.
- Stop-Loss:
- Place a stop-loss order below the lowest point of the tweezer bottom pattern. This protects you from potential losses if the reversal fails.
- Profit Targets:
- Determine profit targets based on:
- Resistance levels.
- Previous highs.
- Fibonacci retracement levels.
- Determine profit targets based on:
- Risk Management:
- Always practice sound risk management. Never risk more than you can afford to lose.
- Adjust position sizes to reflect your risk tolerance.
Important Considerations:
- False Signals:
- Like all technical patterns, the tweezer bottom can produce false signals.5
- Market Context:
- Consider the overall market context. A tweezer bottom in a strong overall downtrend may be less reliable.
- Practice:
- Practice identifying and trading the pattern in a demo account before risking real money.
By combining the identification of the tweezer bottom pattern with sound trading strategies and risk management, you can increase your chances of successful trades.