


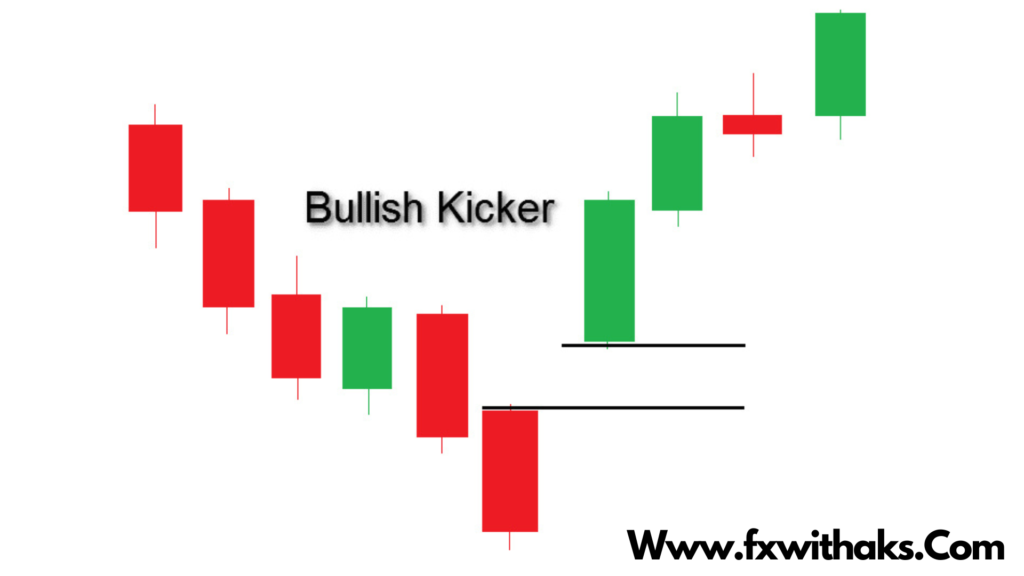
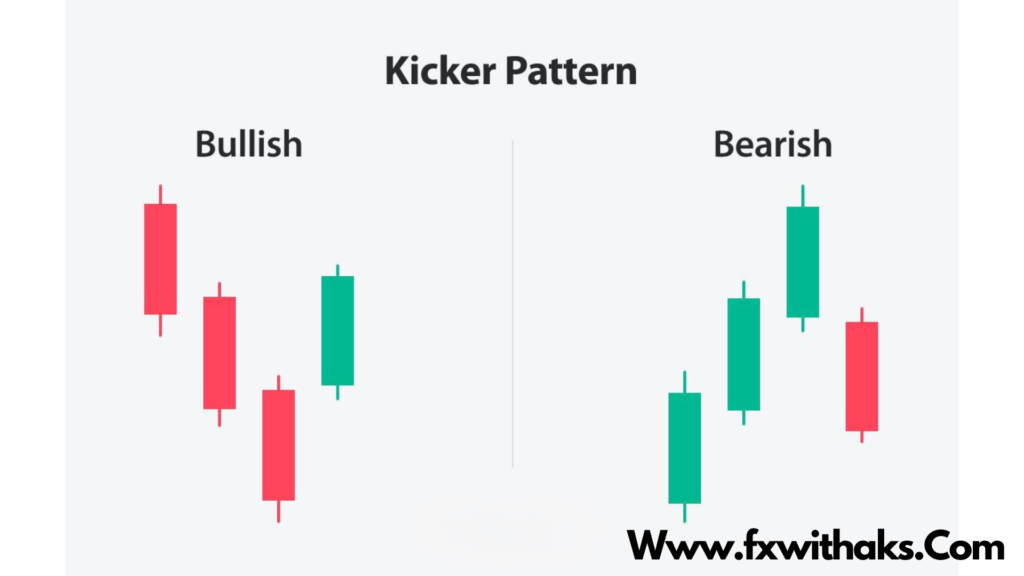
The Bullish Kicker Candlestick is one of the most powerful bullish reversal patterns in candlestick charting. It represents a sudden and aggressive shift in sentiment from bearish to bullish — often caused by unexpected news, earnings, or strong buying momentum.
📌 What It Looks Like
It’s a two-candle pattern:
- First Candle: A big red (bearish) candle.
- Second Candle: A big green (bullish) candle that:
- Opens at or above the previous open, creating a gap up.
- Ignores the previous candle completely and surges higher.
- No overlap between the two candle bodies = strong signal.
🔍 Visual Representation:
Day 1:   ████▌        (Bearish candle)
Day 2:        ▐████   (Bullish candle with a gap up)
🧠 What It Means
- Day 1: Sellers are fully in control.
- Day 2: The market gaps up and bulls dominate, completely erasing bearish pressure.
- This “kick” in momentum shows strong conviction — typically institutions or big money stepping in.
✅ Bullish Kicker Checklist
| Requirement | Explanation |
|---|---|
| ❗ Strong red candle | Big bearish candle on day one |
| 🚀 Gap up open | Second candle opens above day one’s open |
| ✅ Big green candle | Closes much higher, showing strong buying |
| 🔥 No overlap | Bodies of the candles don’t overlap |
| 🔊 High volume | (Optional) But adds credibility |
📈 Trading Strategy
1. Identify the Pattern
- Spot the red candle followed by a gap-up green candle.
- Ideally on daily or weekly timeframes for higher reliability.
2. Enter the Trade
- Option A: Enter at the close of the green candle (once it forms).
- Option B: Enter on the next candle if it breaks the high of the bullish kicker.
3. Set Stop-Loss
- Just below the low of the green candle (or the red candle if you want a wider stop).
4. Set Profit Target
- Target previous resistance, swing highs, or use a 2:1 or 3:1 risk/reward ratio.
🧠 Pro Tips
- Combine with volume or support zones for stronger signals.
- Best used when it appears at major bottoms or after downtrends.
- Use with other indicators (like RSI or MACD) to build confluence.
Want me to generate a sample chart with a Bullish Kicker? Or a cheat sheet with entries/stops/targets?
Trading the Bullish Kicker Candlestick is all about recognizing the sudden momentum shift and jumping in smartly with proper risk management. Here’s a step-by-step guide to trading it like a pro:
🚀 How to Trade the Bullish Kicker Candlestick
🔍 Step 1: Spot the Pattern
- Look for a strong bearish (red) candle followed by a large bullish (green) candle.
- The green candle should gap up and open at or above the previous open, with no overlap between the two bodies.
📌 This shows a clear shift in market sentiment — buyers are now fully in control.
✅ Step 2: Confirm the Signal
- Confirm the second candle closes strong (near its high).
- Optional but helpful: Check for increased volume on the bullish candle.
- Use other tools like support zones, RSI divergence, or MACD crossover to increase your confidence.
💼 Step 3: Enter the Trade
Two entry options:
- Conservative Entry: Wait for the next candle to break above the high of the bullish kicker.
- Aggressive Entry: Enter at the close of the kicker candle if it’s strong and confirms the reversal.
🛡️ Step 4: Set Your Stop-Loss
- Place stop-loss below the low of the bullish kicker candle (safe).
- More conservative: Below the low of the bearish candle (gives more room).
🎯 Step 5: Take-Profit Strategy
Choose one of these:
- 📈 Target Resistance: Set your take-profit at the next resistance level.
- 🎯 Risk/Reward Ratio: Use a 2:1 or 3:1 ratio (e.g., risk 1% to make 2-3%).
- 🌀 Trailing Stop: If the trend is strong, trail your stop to ride the move longer.
🔑 Example Trade Setup
| Element | Value |
|---|---|
| Timeframe | Daily chart |
| Pattern | Bullish Kicker after downtrend |
| Entry | Break of kicker candle high |
| Stop-Loss | Below kicker candle low |
| Target | Next resistance / 2:1 R:R |
📌 Pro Tips
- Use higher timeframes (like daily) for more reliable signals.
- Combine with indicators like volume, RSI, trendlines.
- Avoid trading it in choppy or sideways markets.
Would you like a visual chart example of a Bullish Kicker setup? Or a quick cheat sheet you can save? Comment Must