

Downtrend trading involves taking advantage of markets where prices are consistently moving lower. Traders aim to profit from declining prices by short selling or using derivative instruments like options or futures.
🔻 Key Characteristics of a Downtrend
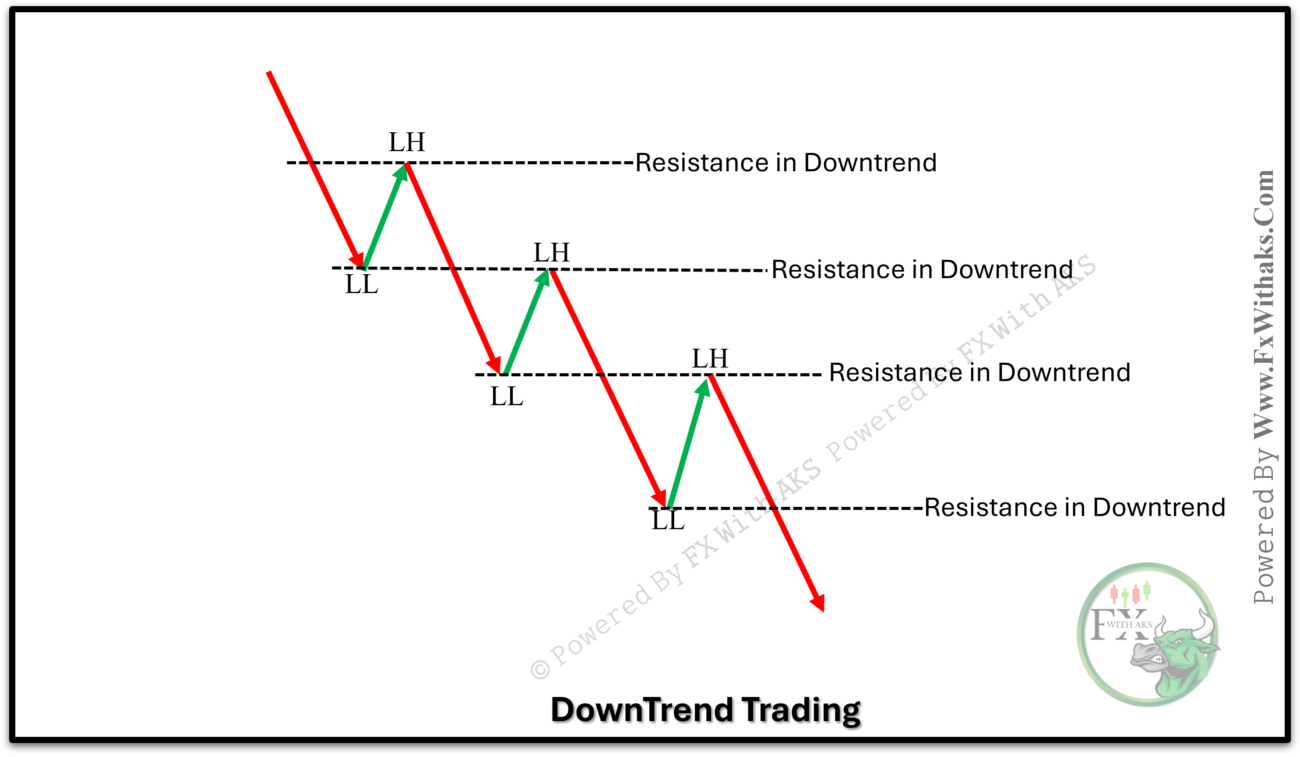
A downtrend is identified by:
- Lower highs and lower lows
- Price trading below key moving averages
- Bearish candlestick patterns (e.g., evening star, bearish engulfing)
- Confirming volume spikes on down moves

📉 How to Trade a Downtrend
1. Identify the Downtrend
Use tools like:
- Trendlines: Drawn along lower highs
- Moving Averages: Price consistently below 50-day or 200-day MA
- Indicators: MACD below signal line, RSI below 50
2. Enter the Trade
Short entries are typically taken when:
- Price pulls back to resistance (e.g., old support, moving average)
- Breaks support (confirming continuation)
- Bearish chart patterns appear (e.g., head and shoulders, descending triangles)
3. Set Stop-Loss
- Place above the recent swing high
- Or above a resistance level or moving average
4. Set Take-Profit Targets
- Recent support levels
- Fibonacci retracement or extension targets
- Use trailing stops to lock in gains as price falls
🔧 Useful Tools & Indicators
| Tool/Indicator | Use |
|---|---|
| Moving Averages (MA/EMA) | Identify resistance and trend |
| RSI | Bearish momentum when < 50 |
| MACD | Confirms downward momentum |
| Volume | Validates selling pressure |
| Trendlines | Entry/exit points |
⚠️ Tips for Trading Downtrends
- Don’t fight the trend—avoid long trades in strong downtrends.
- Use tight risk control, as short trades can turn quickly.
- Monitor for bullish divergences (early sign of reversal).
- Downtrends can be steep but short-lived, especially in equities.
Would you like a live chart analysis example or a strategy guide using a specific indicator (e.g., MACD or RSI) for downtrend trading?