
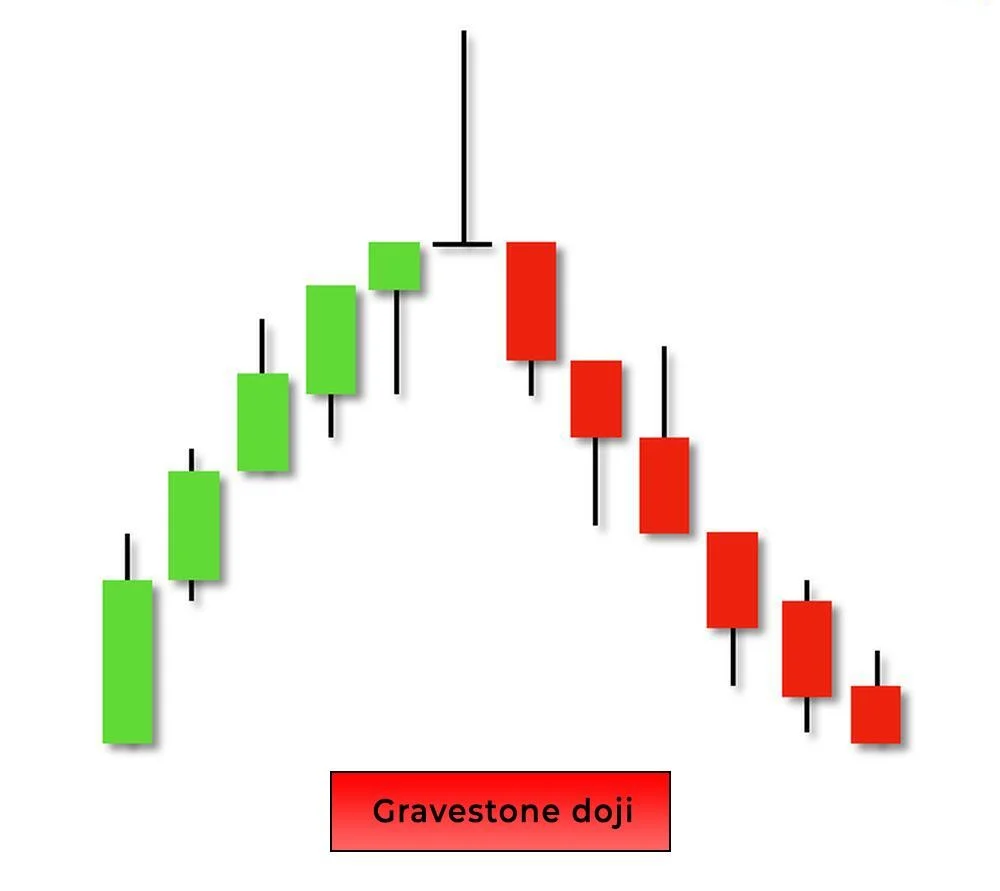
The Gravestone Doji is a bearish reversal candlestick pattern that typically appears at the top of an uptrend. It represents a strong rejection of higher prices, and suggests that buyers lost control, giving way to potential downward movement.
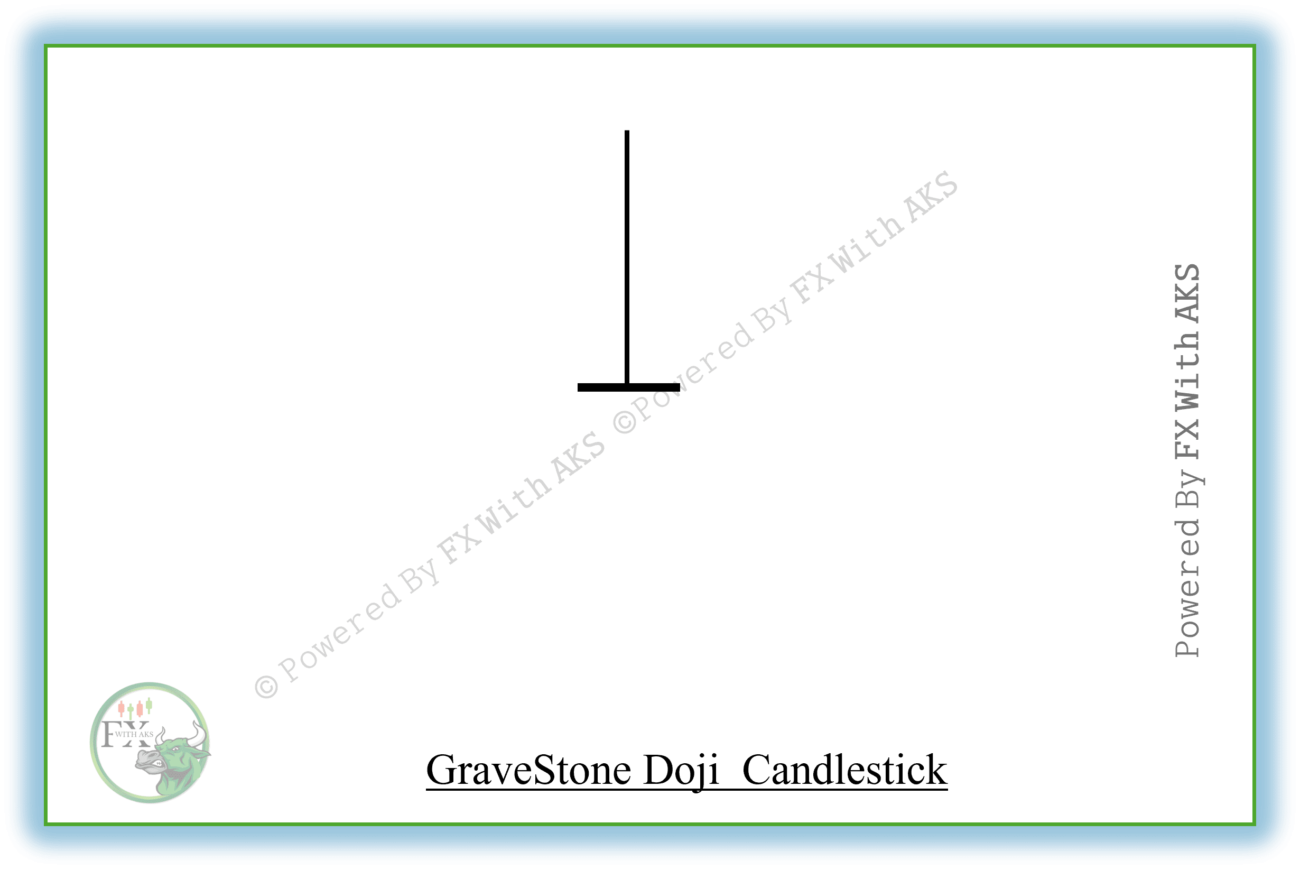
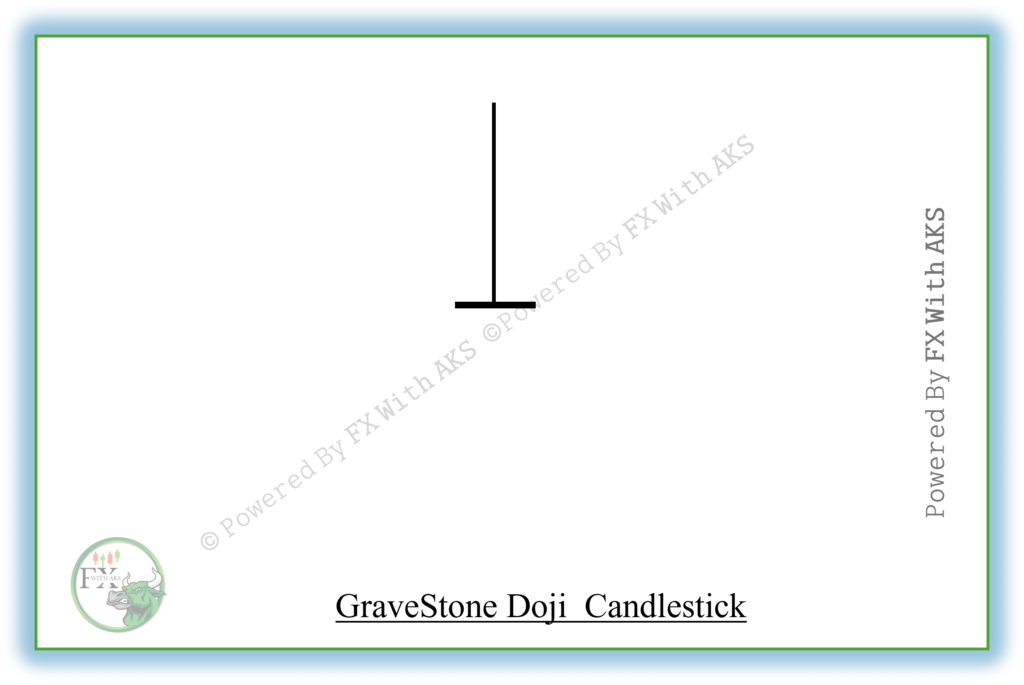
🕯️ Structure of a Gravestone Doji
- Open, Low, and Close prices are virtually the same.
- Long upper shadow (wick) — price went much higher during the session, but couldn’t hold.
- No or very little lower shadow.
    High
     │
     ───────
          ● ← Open = Close = Low
This shape resembles a gravestone, hence the name — symbolizing the possible “death” of the uptrend.
📉 Interpretation
- The market opens, rallies strongly, but sellers take over and push the price back to the open/low.
- This shows complete rejection of bullish pressure.
- Often signals the top of a rally or resistance level rejection.
✅ Stronger Signal When:
- Occurs after a strong uptrend.
- Followed by a bearish confirmation candle (e.g., strong red close).
- Accompanied by high volume, indicating distribution.
- Appears near resistance levels or overbought zones (e.g., RSI > 70).
🔁 Comparison with Similar Candles
| Pattern | Trend | Signal | Key Feature |
|---|---|---|---|
| Gravestone Doji | Up | Bearish | Doji with long upper wick |
| Shooting Star | Up | Bearish | Small body + long upper wick |
| Dragonfly Doji | Down | Bullish | Long lower wick, no upper |
⚠️ Pro Tip
- The Gravestone Doji alone isn’t a trade signal — wait for confirmation on the next candle.
- Use in combination with tools like resistance lines, volume spikes, or divergence indicators for more reliable setups.
Would you like to see this pattern on a chart, or get code to detect it in TradingView or Python?