

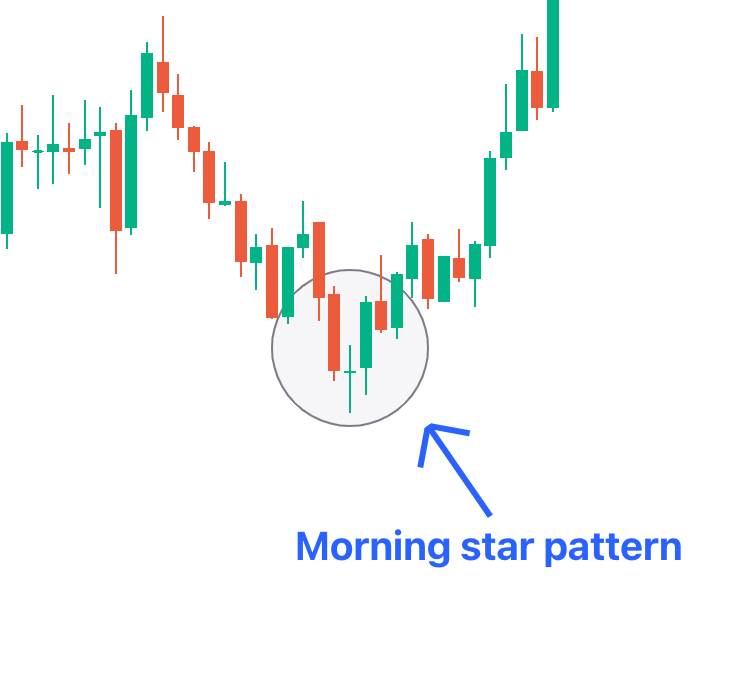
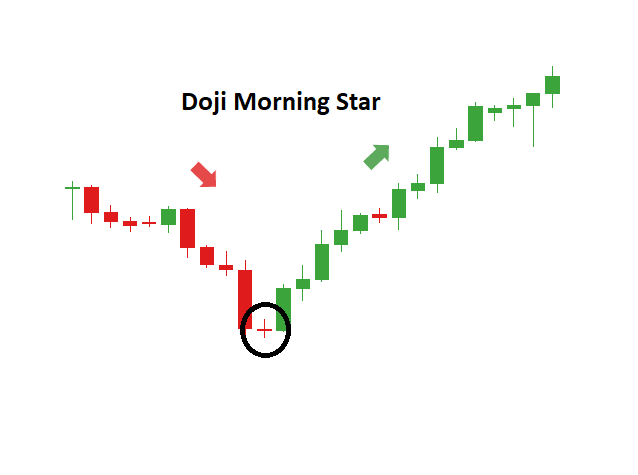
The Morning Star Doji is a powerful bullish reversal candlestick pattern that typically appears at the bottom of a downtrend. It signals a potential shift from bearish to bullish sentiment and is a variation of the standard Morning Star pattern, with the middle candle being a Doji (showing indecision).
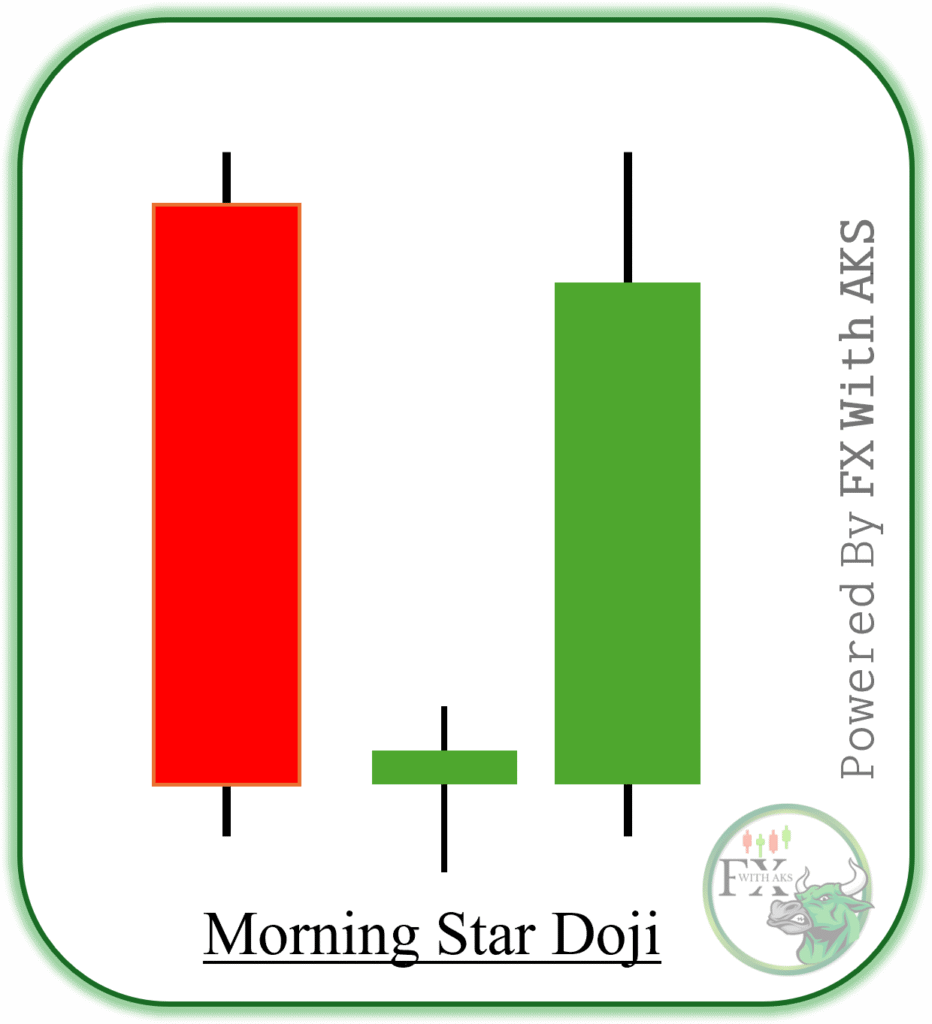
🧱 Structure of Morning Star Doji Pattern
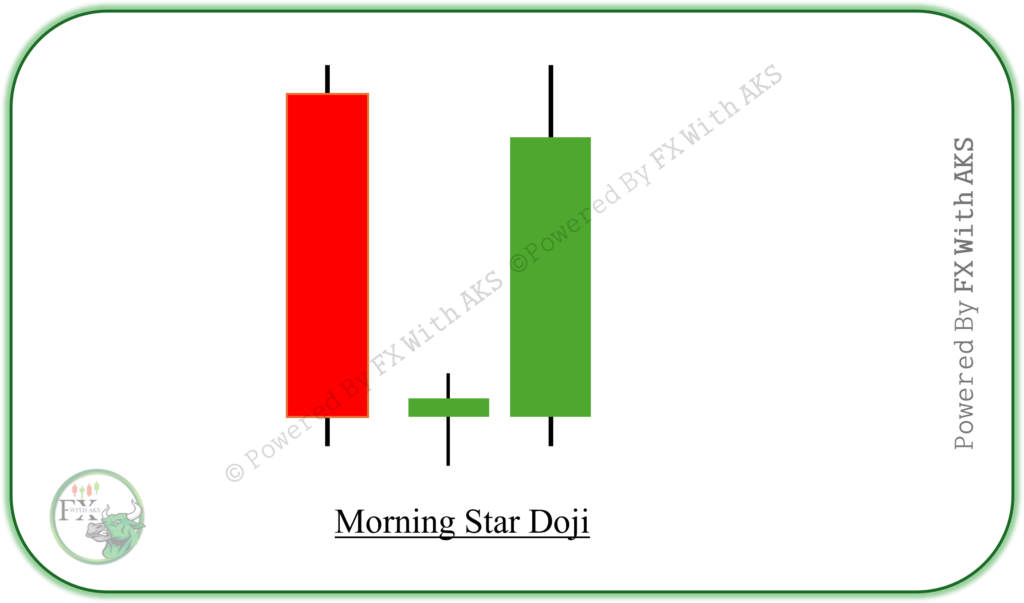
It is a three-candle formation:
- First Candle – Large bearish (red) candle
🔻 Indicates strong selling pressure - Second Candle – Doji
➖ Open and close are nearly the same, showing market indecision
➖ Sellers are losing momentum - Third Candle – Large bullish (green) candle
🔼 Confirms reversal; buyers step in strongly
📊 Chart Context
- Appears after a downtrend
- Works best near support levels
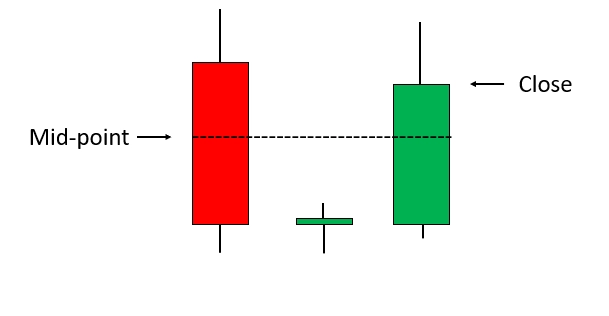
- Confirms when the third candle closes above the midpoint of the first candle
✔️ How to Trade Morning Star Doji
Entry:
- Enter a buy (long) trade at the close of the third candle
- Alternatively, wait for a break above the high of the third candle for confirmation
Stop-Loss:
- Below the low of the Doji (second candle) or entire pattern
Take-Profit (TP):
- Use nearby resistance levels or previous swing highs as TP targets
✅ Tips for Higher Accuracy
- Combine with volume spike on third candle
- Look for confirmation from RSI divergence or oversold condition
- Use on higher timeframes (H1, H4, D1) for stronger signals
Would you like:
- A diagram showing a Morning Star Doji pattern?
- A real chart example annotated?
- This explanation added to the PDF guide?
Let me know what you’d prefer!